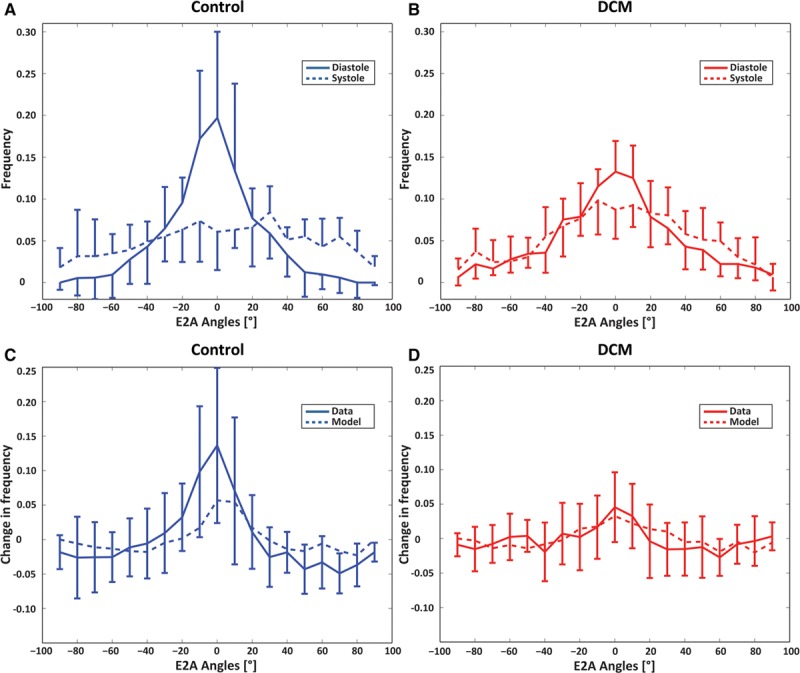
Figure 4.

Histograms of diastolic and systolic E2A sheet angles for controls (A) and patients with dilated cardiomyopathy (DCM; B). The sheet angle distribution is broader in the systolic healthy heart compared with diastole, whereas systolic and diastolic distributions are similar in the DCM case. Histograms of change between diastolic and systolic E2A distributions for controls (C) and patients with DCM (D). Controls exhibit a marked change in E2A as opposed to little change in patients with DCM. Model results follow a similar trend. Error bars indicate interquartile ranges across the subjects.
