
Figure 2.
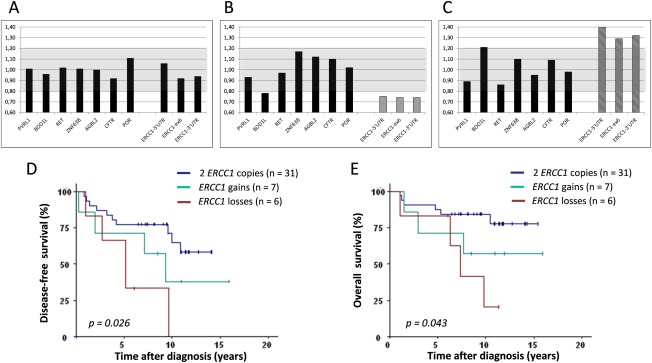
Post‐NCT ERCC1 copy‐numbers: detection and correlation with survival. (A‐C): Determination of ERCC1 gene copy numbers. ERCC1 copy numbers were evaluated by QMF‐PCR with three distinct probes on the ERCC1 gene (localized in 5′UTR, Exon 6 and 3′UTR) and seven other genes serving as controls (PVRL1, BOD1L, RET, ZNF638, AGBL2, CFTR and POR). The gray zone corresponds to normal gene‐copy number, which was defined as the mean ±3 standard deviations of controls. Three examples of ERCC1 profiles are presented: two copies (A), loss (B) and gain (C). (D‐E) Survival analysis. ERCC1 losses and gains were associated with significantly shorter DFS (D) and OS (E) than in the group without CNVs. ERCC1 losses are associated with the worst survival and gains with an intermediate survival.