Figure 3.

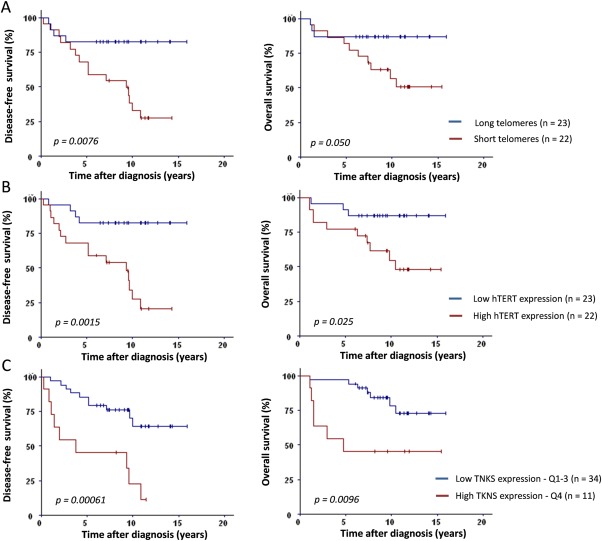
Post‐NCT telomere length, hTERT and TNKS expression levels are predictive of disease‐free and overall survival. (A) Median telomere length (T/S ratio of 1.03) was used to separate tumours into two groups: long (blue line) versus short (red line) telomeres. Short telomeres were significantly associated with worse DFS (p = 0.0076) and OS (p = 0.050). (B) Tumours were divided into low hTERT (blue line) versus high hTERT (red line) expression according to the median value (NCN of 3.5). High hTERT expression was significantly correlated with worse DFS (p = 0.0015) and OS (p = 0.025). (C) Higher TNKS expression (fourth quartile, TNKS ≥ 443, red line) was significantly associated with worse DFS (p = 0.00061) and OS (p = 0.0096).
