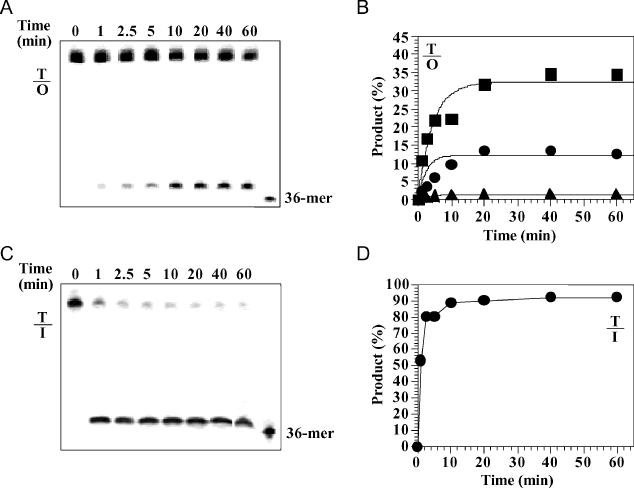
Figure 4.

Time course analysis of T/O and T/I cleavage by Tma endo V. Cleavage reactions were performed as described in Materials and Methods with 1 nM Tma endo V (triangles), 10 nM (circles) and 100 nM (squares). Reactions were stopped on ice at indicated time points and followed by adding equal volume GeneScan stop buffer. (A) Representative GeneScan gel analysis of T/O cleavage (E:S = 10:1). (B) Plots of T/O cleavage. (C) Representative GeneScan gel analysis of T/I cleavage (E:S = 1:1). (D) Plot of T/I cleavage (E:S = 1:1).
