Figure 5.
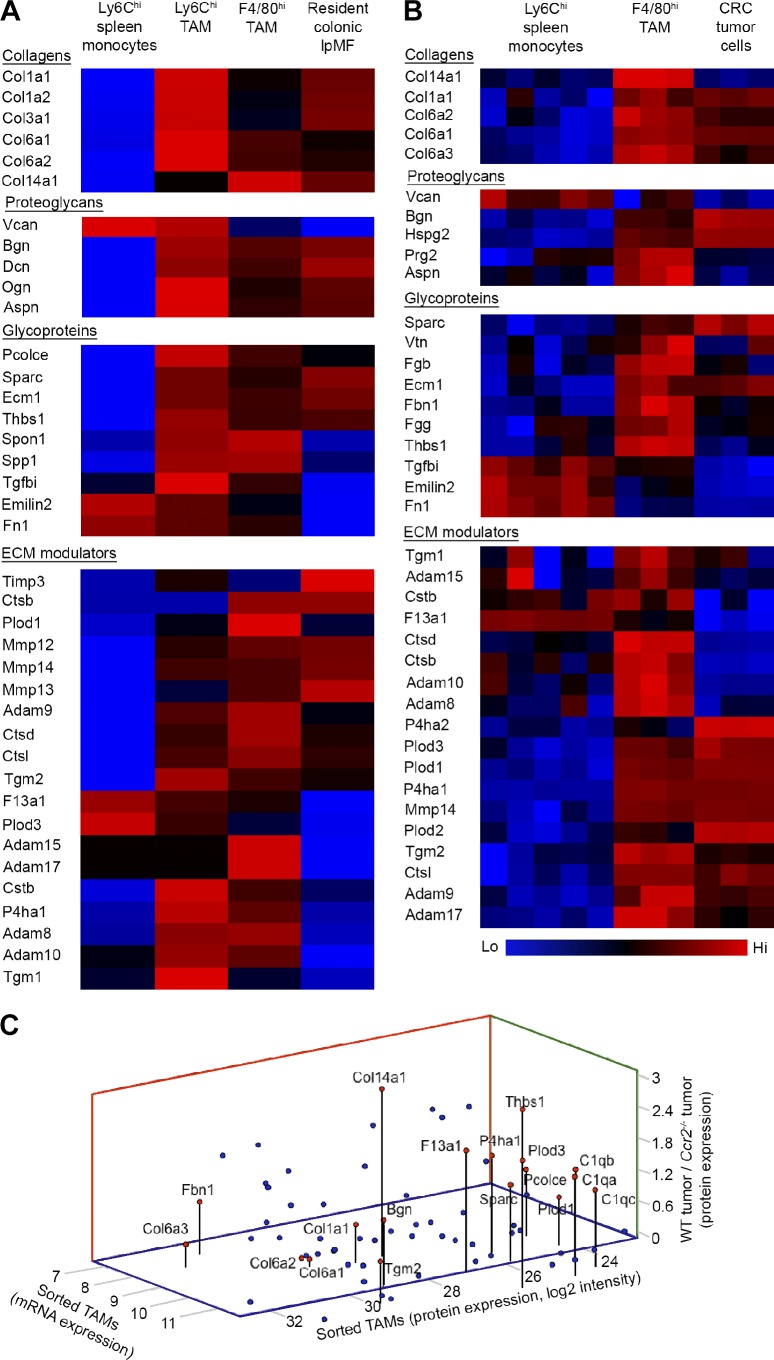
Transcriptomic and proteomic analyses of TAM’s ECM signature. (A) Color-coded Affymetrix gene array heat maps displaying the ECM-related gene expression in sorted Ly6Chi and F4/80hi TAMs (day-14 tumors) in comparison with their Ly6Chi monocyte precursors (splenic reservoir) and resident lpMFs sorted from upstream normal colon. Data were z scored and represent the average of two biological repeats; each was extracted from a pool of mice (splenic monocytes, n = 5; TAMs and colonic lpMFs, n ≥ 10). (B) Color-coded heat maps presenting ECM-related proteins found by LC-MS/MS analysis to be significantly and differentially expressed in sorted F4/80hi TAMs in comparison with their Ly6Chi monocyte precursors and colocalizing colorectal tumor cells. Ly6Chi monocytes: five biological repeats; each was extracted from a pool of three mice. F4/80hi TAMs and CRC cells: three biological repeats; each was extracted from a pool of five mice. Data were analyzed by unpaired, two-tailed Student’s t tests (pFDR = 0.05) and z scored. (C) Graphical summary showing ECM molecules that were mutually expressed (log2) at the protein level in sorted F4/80hi TAMs (x axis) and at the RNA level in sorted F4/80hi TAMs (y axis) and were higher in the TAM-sufficient (WT) versus TAM-deficient (Ccr2−/−) tumors (z axis). Each dot represents an ECM protein; red dots highlight proteins associated with fibrous ECM formation.

