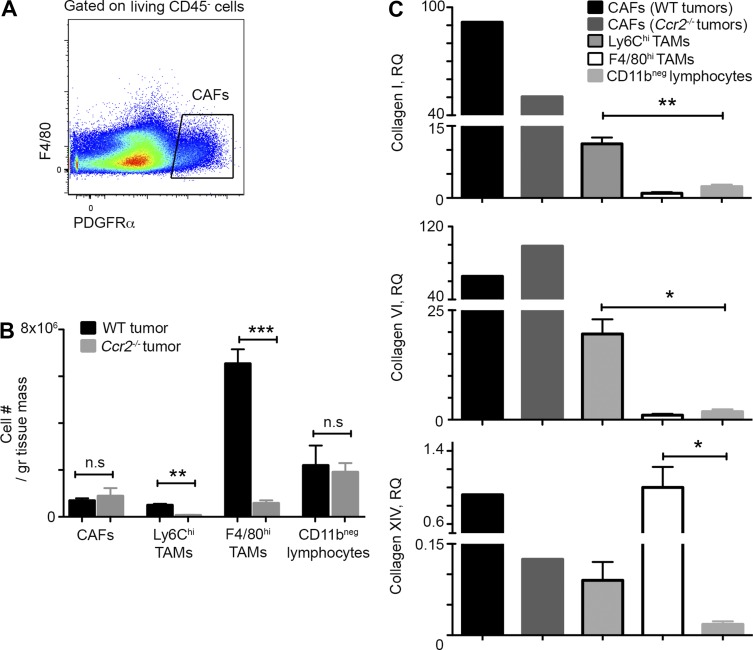
Figure 7.
TAM deficiency reduces collagen XIV and I gene expression in CAFs. (A) Flow cytometry analysis was performed in day 14 tumors, and CAFs were identified as living CD45−CD11b−F4/80−PDGFRα+ cells (Erez et al., 2010; Sharon et al., 2013). (B) Graphic summary of flow cytometry results presenting cell population number normalized for tumor mass comparing WT with Ccr2−/− tumors. n ≥ 3 tumors in each group. gr, gram. (C) Quantitative real-time PCR analysis showing the relative gene expression of collagens I, VI, and XIV in comparison with F4/80hi TAMs. CAFs were sorted out of pool of 20 WT or Ccr2−/− tumors. For the other populations, data were extracted from three biological repeats; each was extracted from pool of six to seven mice. RQ, relative quantification. Data were analyzed by unpaired, two-tailed Student’s t tests and are presented as mean ± standard error of the mean. *, P < 0.05; **, P < 0.01; ***, P < 0.001.

