Figure 8.
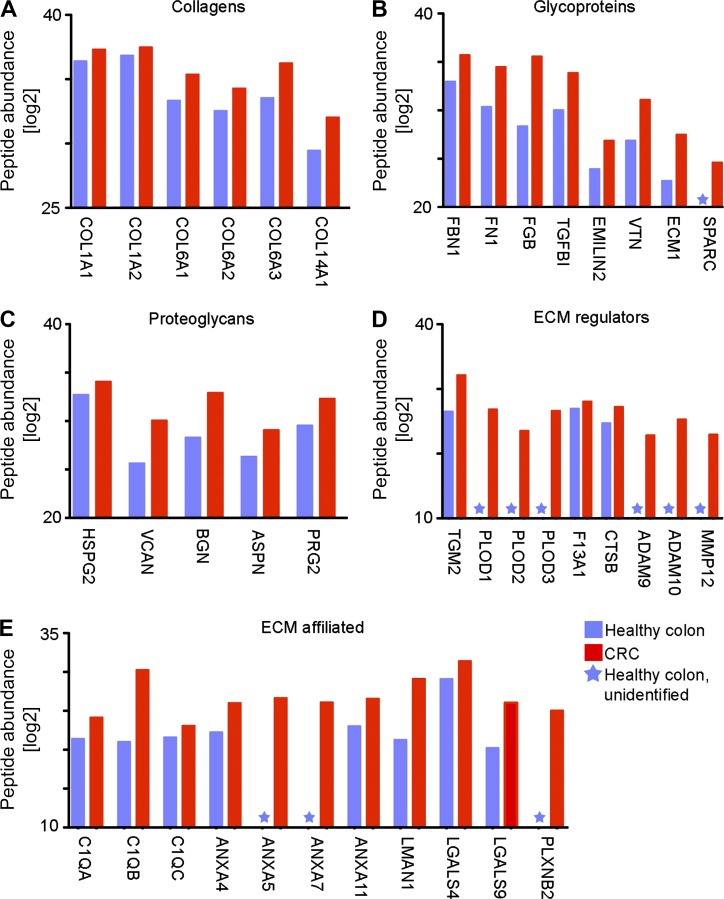
TAM-defined ECM proteins are increased in human CRC. (A–E) Graphic representation of protein expression levels of collagens (A), glycoproteins (B), proteoglycans (C), ECM regulators (D), and ECM-affiliated proteins (E). Data are presented as protein abundance (log2 modified) in normal human colon (blue) versus CRC (red) and correspond to the sum of specific peptide abundance across independent samples (three independent samples for each tissue type). Unidentified proteins are marked with a star. These results were analyzed out of a published database (Naba et al., 2014).

