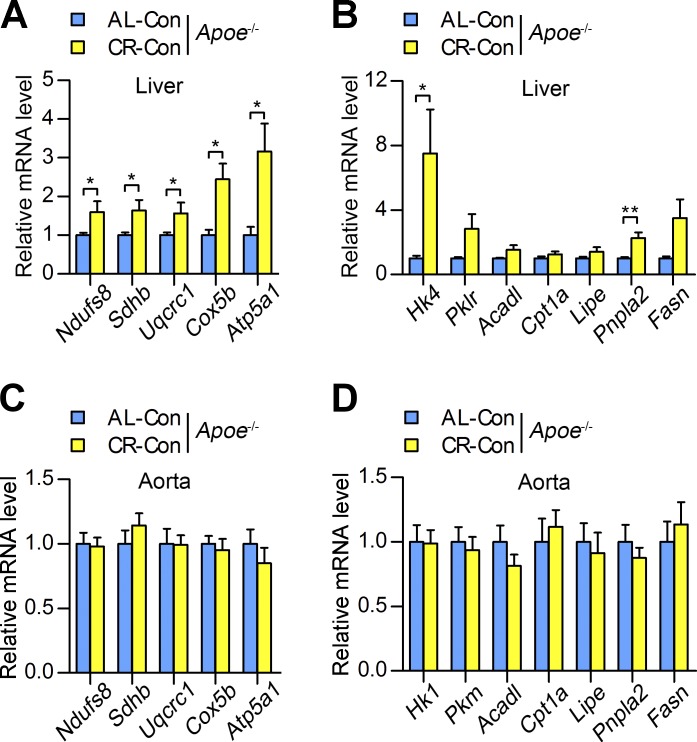
Figure 3.
Expression of genes involved in oxidative phosphorylation and glucose/lipid metabolism in the liver and aorta of Apoe−/− mice after 12 wk of CR. (A) Relative mRNA expression of genes encoding mitochondrial respiratory chain subunits in Apoe−/− mouse livers. n = 8 per group. (B) Relative mRNA expression of genes involved in glucose and lipid metabolism in Apoe−/− mouse livers. n = 8 per group. (C and D) The relative mRNA expression of genes encoding mitochondrial respiratory chain subunits (C), and the genes involved in glucose and lipid metabolism (D) in the aortas of Apoe−/− mice. n = 8–12 per group. Three independent experiments were performed to obtain the data. All values are shown as the means ± SEM. *, P < 0.05; **, P < 0.01. P-values were obtained using an unpaired Student’s t test with Welch’s correction.

