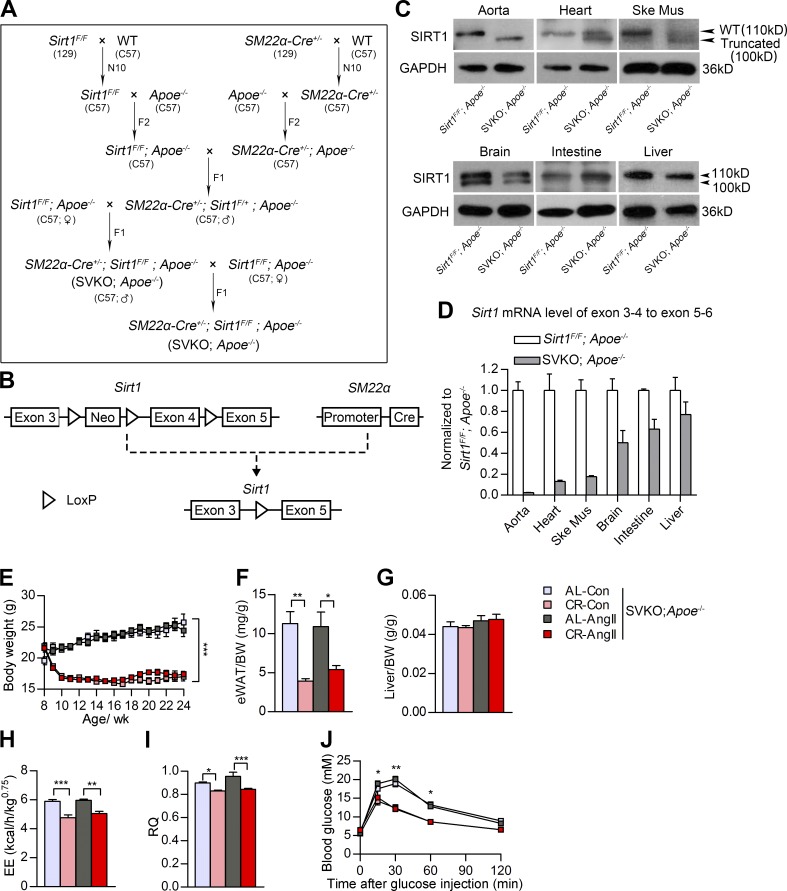
Figure 5.
Systemic metabolic indices of smooth muscle–specific Sirt1 KO (SVKO;Apoe−/−) mice after CR and AngII infusion. (A) Breeding strategy to generate SVKO;Apoe−/− mice. F, filial generations; N, number of backcross generations. (B) The design of a Cre/LoxP system to delete the SIRT1 deacetylase domain, which is encoded by exon 4, in mouse smooth muscle cells. Neo, neomycin. (C) Western blots of SIRT1 in the aorta, heart, skeletal muscle (Ske Mus), brain, small intestine, and liver of WT (Sirt1flox/flox;Apoe−/−) and SVKO;Apoe−/− mice as indicated. (D) Real-time PCR quantification of exons 3–4 of SIRT1 mRNA in different tissues of SVKO mice. All SIRT1 exon 3–4 mRNA expression levels were normalized to SIRT1 exon 5–6 levels. Experiments were performed with three biological replicates. Primer sets used in real-time PCR are provided in Table S2. (E) BW curve of SVKO;Apoe−/− mice. n = 10 in the AL-Con, 10 in the CR-Con, 19 in the AL-AngII, and 21 in the CR-AngII groups. (F and G) The eWAT weight–to-BW ratio (F) and liver weight–to-BW ratio (G) of SVKO;Apoe−/− mice. n = 7–10 per group. (H and I) EE (H) and RQ (I) of SVKO;Apoe−/− mice as measured by indirect calorimetry. n = 4–5 per group. (J) Blood glucose levels during IPGTT (2 g/kg). n = 5 per group. All values are shown as the means ± SEM. *, P < 0.05; **, P < 0.01; ***, P < 0.001. P-values were obtained using two-way repeated-measures ANOVA (E and J), by a Kruskal-Wallis test plus a Dunn’s multiple comparison test (F), or by one-way ANOVA plus a Bonferroni posthoc analysis (G–I).

