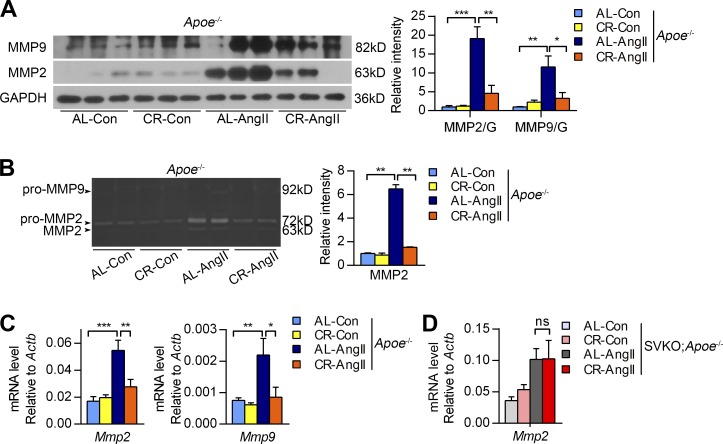
Figure 7.
CR reduces AngII-induced MMP2 expression and activity. (A and B) Western blots (A) and gelatin zymography (B) of MMP2 and MMP9 in the aortas of Apoe−/− mice. Quantitative results are normalized to the AL-Con group values. n = 4–6 per group. (C) Relative mRNA expression of MMP2 and MMP9 in the aortas of Apoe−/− mice. n = 6–12 per group. (D) Relative mRNA expression of MMP2 in the aortas of SVKO;Apoe−/− mice. n = 6–10 per group. (C and D) Data were obtained from three independent experiments. All values are shown as the means ± SEM. *, P < 0.05; **, P < 0.01; ***, P < 0.001. P-values were obtained using a Kruskal-Wallis test plus a Dunn’s multiple comparison test (A and B) or one-way ANOVA plus a Bonferroni posthoc analysis (C and D).

