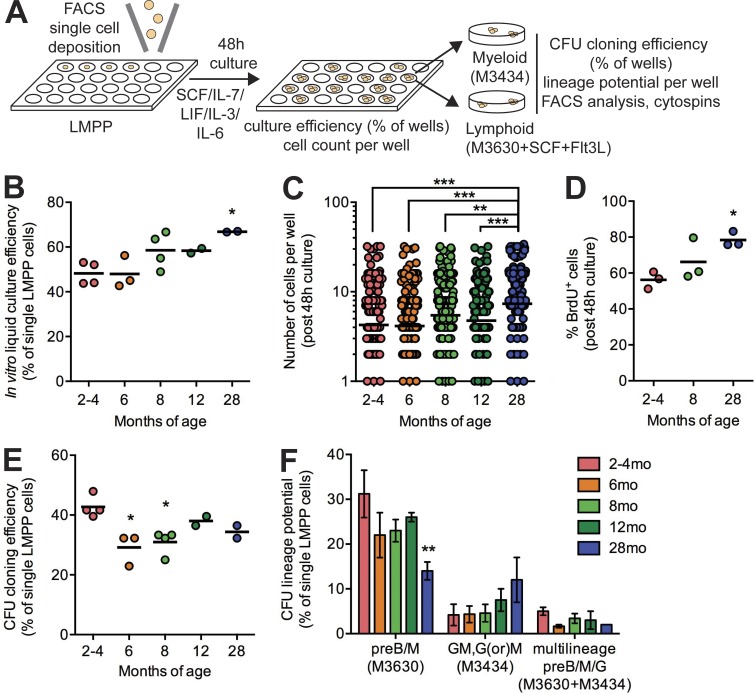
Figure 4.
Impaired lymphoid differentiation of aged LMPPs in vitro. (A) Schematic of single-cell assay design. (B) Frequency of wells found to contain one or more cells after 48-h culture of single LMPP cells. Dots represent a single plate of n = 96 single cells. Bars represent the mean of n = 2 independent experiments. (C) Number of cells counted per well after 48-h culture of single LMPP cells. Dots represent individual wells. Bars represent the mean of n = 288 collected in three independent experiments. (D) Frequency of BrdU+ cells after 48-h culture of LMPP cells by FACS analysis. Dots represent independent experiments, and bars represent the mean of n = 3. (E) Frequency of wells found to form CFUs after 48-h culture of single LMPP cells and plating in methylcellulose assays. Dots represent a single plate of n = 96 single cells. Bars represent the mean of n = 2 independent experiments. (B–E) P-values were generated by one-way ANOVA with Holm-Sidak’s multiple comparisons test. (F) Frequency of wells found to form CFU-preB/M, CFU-GM, or CFU-preB/M/G after 48-h culture of single LMPP cells and plating in methylcellulose assays. Results are shown as mean ± SEM of n = 2–4 in two independent experiments. P-values were generated by two-way ANOVA with Tukey’s multiple comparisons test. *, P < 0.05; **, P < 0.01; ***, P < 0.001.

