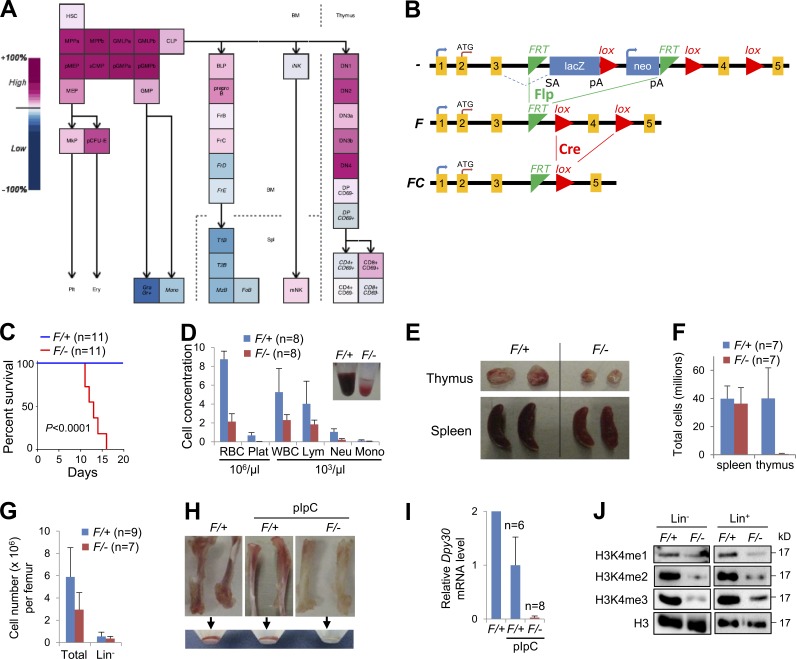
Figure 1.
Dpy30 KO in the hematopoietic system results in depletion of H3K4 methylation and pancytopenia. (A) Dpy30 expression levels in the mouse hematopoietic system, shown as output from Gene Expression Commons. (B) The Dpy30 KO strategy, showing different status of the Dpy30 allele. Dpy30 protein has 99 aa in total, and the domain responsible for facilitating methylation is at the C-terminal half, which is encoded starting within the targeted exon 4, and is thus deleted by Cre-mediated recombination. (C–J) pIpC was injected into Mx1-Cre; Dpy30F/+ (F/+, control) and Mx1-Cre; Dpy30F/− (F/−, KO) mice for 4 times, except in H and I where no pIpC is labeled. All mice were examined 4 d after last pIpC injection. (C) Kaplan-Meier curves for survival of animals after pIpC injections (first pIpC injection on day 0). n = 11 mice for each genotype. P < 0.0001 by log-rank test. (D) Profiles of PB. Insert shows comparison of typical PB samples. n = 8 mice for each genotype. (E) Thymus and spleen in the control and KO mice. (F) Numbers of total splenocytes and thymocytes in the control and KO mice. n = 7 mice for each genotype. (G) Total and Lin− BM cell numbers. n = 9 mice for F/+; n = 7 mice for F/−. (H) Representative long bones and cells flushed from these bones. (I) Relative Dpy30 mRNA levels in BM by RT-qPCR and normalized to Actb. n = 6 mice for F/+; n = 8 mice for F/−; both with pIpC injection. (J) Western blotting for total H3 and different levels of H3K4 methylation in sorted Lin− and Lin+ BM. Data are shown as mean ± SD for D, F, G, and I.

