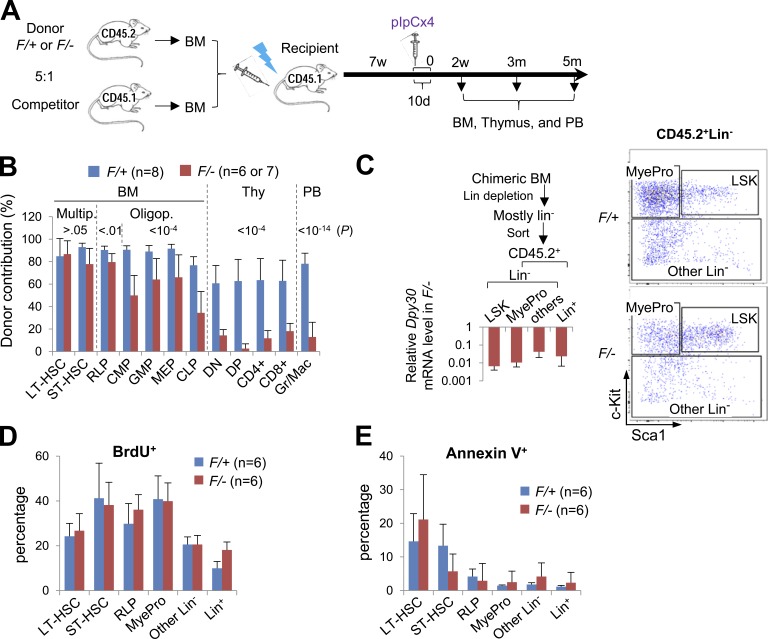
Figure 4.
Short-term BM chimera system further reveals differentiation defects of Dpy30 KO HSPCs. (A) Scheme for the mixed BM chimera system using whole BM from Mx1-Cre; Dpy30F/+ or Mx1-Cre; Dpy30F/− mice as donors and from CD45.1+ mice as competitors (donor: competitor = 5:1). This scheme is for all panels in Figs. 4, 5, 6,and 7, except for Fig. 6 (C and D) and Fig. 7 D. (B–E) Analyses of donor-derived cells 2 wk after pIpC injections. (B) Donor contribution to different cell populations in BM chimeras. n = 8 (recipient) mice for F/+; n = 6 or 7 mice for F/-. P > 0.05 for multipotent cells; P < 0.01 for RLP; P < 10−4 for CMP, GMP, MEP, and thymocytes; P < 10−14 for PB, by Student’s t test. (C) Different populations of donor-derived cells were isolated following the scheme on the left. Dpy30 mRNA levels in sorted F/− relative to F/+ cells (set as 1) of the same cell types were determined by RT-qPCR and normalized to Actb. n = 5 mice for each genotype. Shown on the right is a representative FACS sorting of CD45.2+Lin− cells. (D) BrdU incorporation assay for different (donor-derived) cell populations in chimera BM. n = 6 mice for each genotype. P > 0.2 for all cell types except Lin+ (P = 0.002) by Student’s t test. (E) Annexin V staining for different (donor-derived) cell populations in chimera BM. n = 6 mice for each genotype. P > 0.1 for all cell types except ST-HSC (P = 0.05) by Student’s t test. Data are shown as mean ± SD for B–E.

