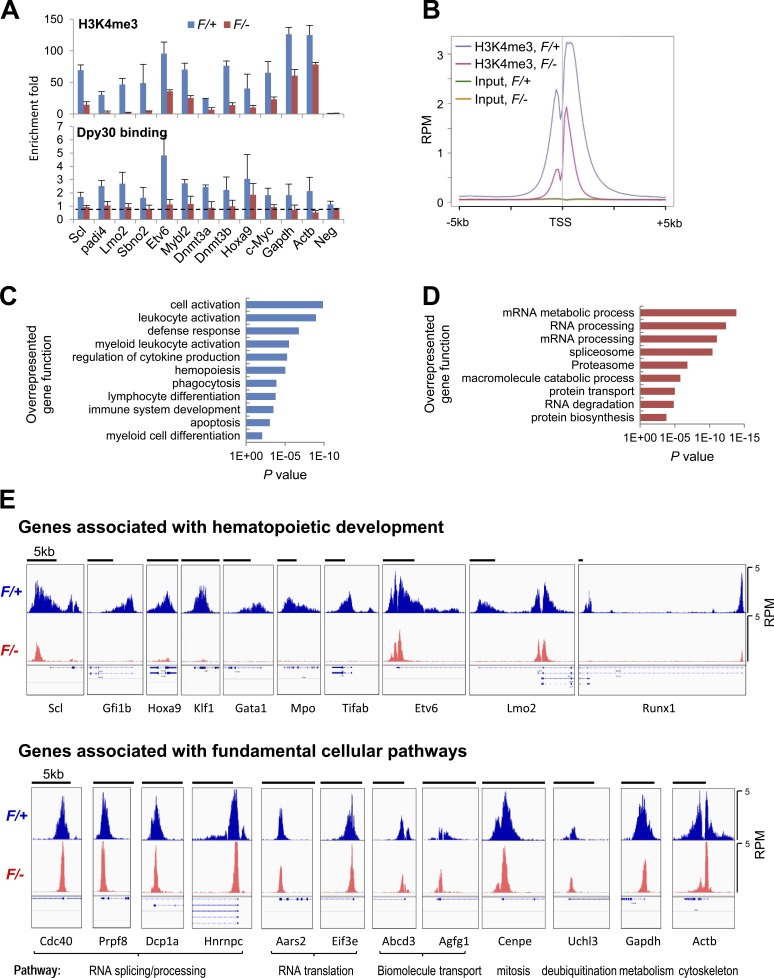
Figure 8.
Differential effect of Dpy30 KO on genomic H3K4me3. (A) ChIP for H3K4me3 (top) and Dpy30 (bottom) using Lin− BM cells from Mx1-Cre; Dpy30F/+ and Mx1-Cre; Dpy30F/− mice 4 d after the last pIpC injection, and shown as mean ± SD from three independent injection experiments. The dotted line in the bottom panel represents the approximate level of nonspecific ChIP signal that needs to be subtracted when assessing the Dpy30-specific binding level, given the thorough depletion of Dpy30 in the KO cells. (B) The composite profiles of indicated ChIP-seq results for all genes that has an H3K4me3 peak within 5 kb up- or downstream of its TSS. (C and D) Gene ontology analysis by DAVID for genes with >90% reduction (C) or <50% reduction (D) of H3K4me3 at TSS regions in the F/– (KO) compared with the F/+ (control) cells (see Table S4 for the gene lists). (E) H3K4me3 ChIP-seq profiles shown in Integrated Genomic Viewer for the representative genes associated with hematopoietic development (top) and genes associated with various fundamental cellular pathways (bottom). The black bars on top of each panel show 5-kb scale. All panels have the same signal scale of 0–5 RPM on the y axis. The expanded RefSeq genes are shown below each panel to show the transcript isoforms, including those with alternative TSSs (and thus multiple H3K4me3 peaks).

