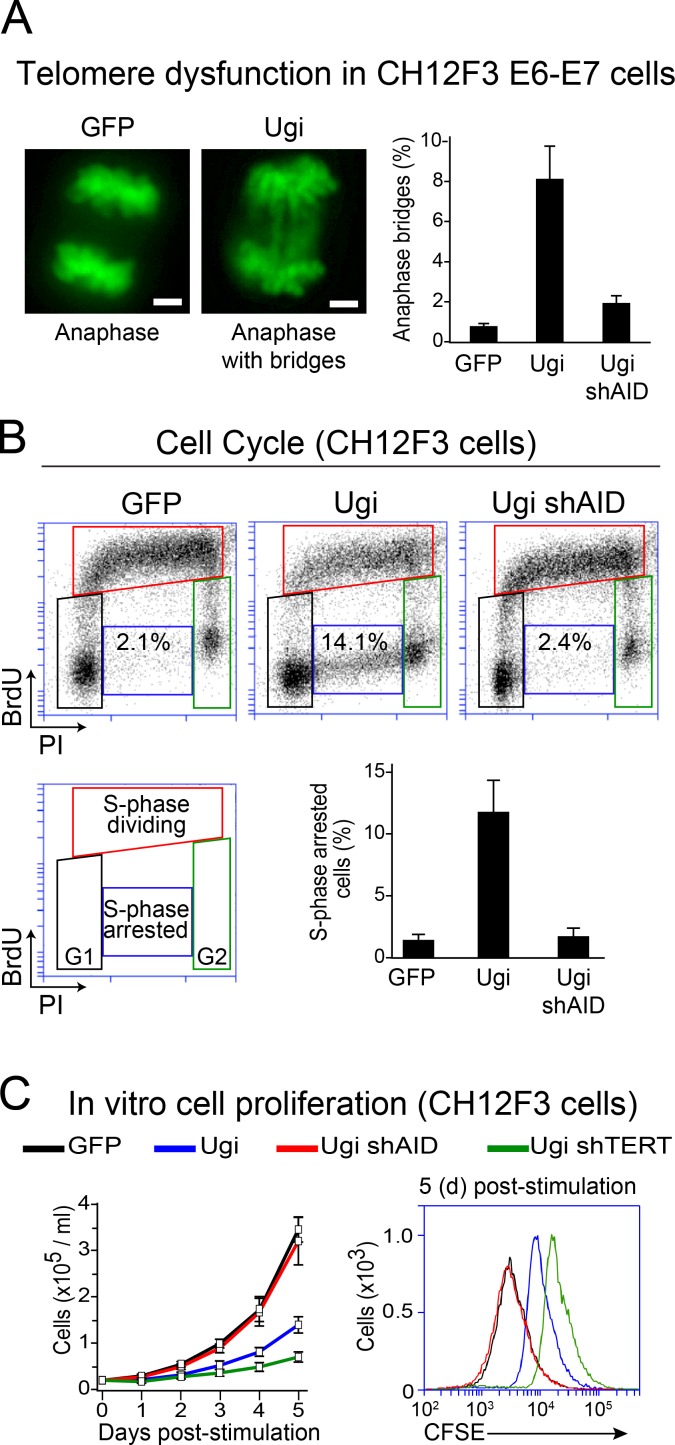
Figure 4.
Compromised proliferation of Ung-deficient B cells expressing AID. (A, left) Representative microscopy pictures of anaphases from CH12F3 cells expressing the HPV16 E6 and E7 oncoproteins and GFP control, Ugi, or Ugi shAID. Total DNA was stained with DAPI (shown in green). Bars, 2 µm. (Right) Mean + SD proportion of anaphases showing chromosome bridges in CH12F3 GFP and CH12F3 Ugi cells from at least three independent experiments. 50 anaphases were analyzed for each cell line per experiment. (B) Cell cycle profile analysis by BrdU incorporation and propidium iodide (PI) staining in the indicated CH12F3 cells 24 h after stimulating CSR. (C) Cell number (left) and CFSE staining (right) were used to evaluate cellular proliferation of dCH12F3 and CH12F3 Ugi cells expressing the indicated shRNAs after stimulation for CSR. Error bars represent mean + SD from at least three independent experiments. shTERT, shRNA against the telomerase reverse transcriptase (TERT).

