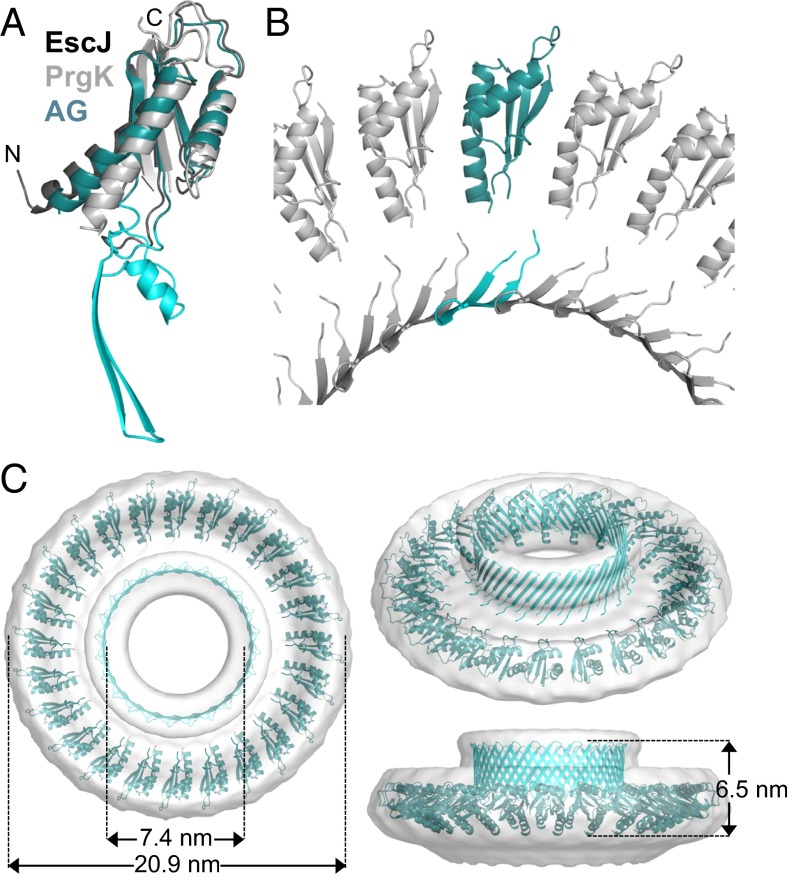
Fig. 3.
3D modeling of the AG ring. (A) Ribbon representation of the raw AGBsu D2 model (AG) superimposed on the D2 structures of EscJ (dark gray) and PrgK (light gray). The AGBsu regions homologous to EscJ/PrgK are in teal, and the insertion region is in cyan. (B) Close-up view of the modeled AGBsu D2 ring. (C) Ribbon representation of the AGBsu D2 ring model in the EM map density (SI Materials and Methods).

