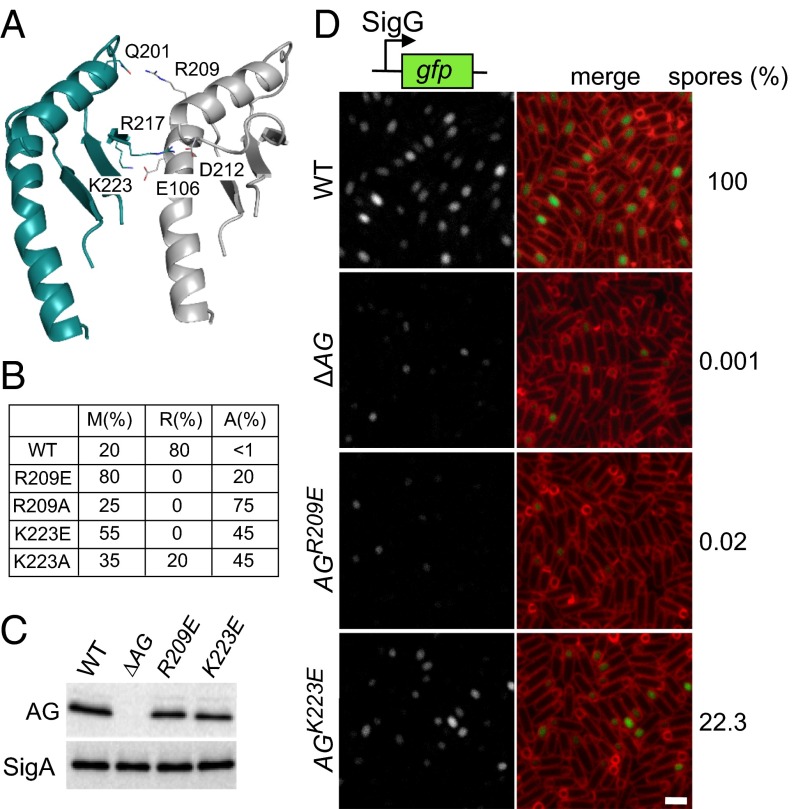
Fig. 4.
In vitro and in vivo test of the AG ring model. (A) Close-up view of the interface between two adjacent subunits in the saucer region of the AGBsu D2 ring model. Residues predicted to make up the oligomeric interface are labeled. (B) Table showing the proportion of monomers (M), rings (R), and aggregates (A) assessed by gel filtration and negative-stain EM for the AGBsu D1+D2 variants. The primary data can be found in Fig. S5. (C) Immunoblot analysis of whole-cell lysates from sporulating wild-type (BCR1434), ΔAG mutant (BCR776), AG(R209E) (BCR1435), and AG(K223E) (BCR1436) with anti-AG antibodies. SigA levels were monitored to control for loading. (D) SigG activity (Left) and sporulation efficiency (Right) of B. subtilis cells with AG mutants. Wild-type (BCR1438), ΔAG mutant (BCR1437), and cells expressing AG(R209E) (BCR1439) or AG(K223E) (BCR1440) were visualized 4 h after the initiation of sporulation. All strains harbor a SigG-responsive promoter (PsspB) fused to GFP. Images of PsspB-GFP fluorescence (Left) and of PsspB-GFP fluorescence images merged with TMA-DPH–stained membranes (Right) are shown. The images were scaled identically. (Scale bar, 2 μm.)

