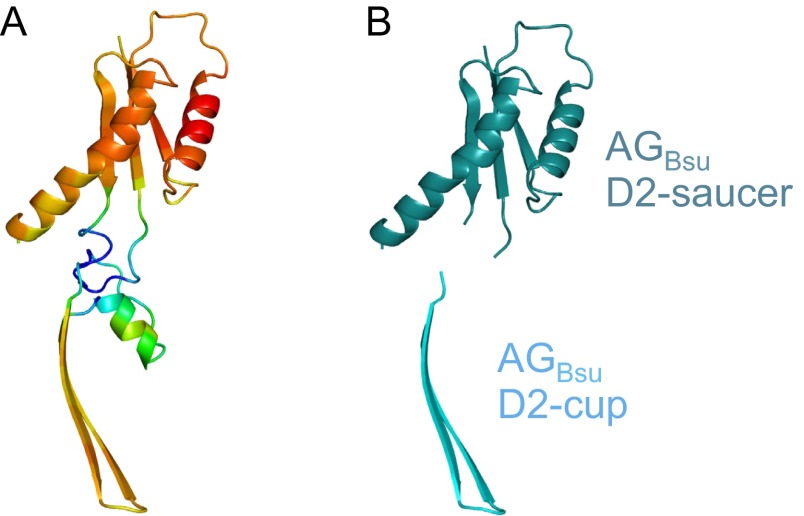
Fig. S3.
3D modeling of the AGBsu ring. (A) Ribbon representation of the raw AGBsu D2 model colored by model quality value. Red corresponds to regions with high-quality values (∼0.8) and are built on X-ray structures. Blue regions have low-quality values (∼0.1) and are built from loop databases without template contribution. (B) Ribbon representation of the domains in the AGBsu D2 model that were used for modeling the AGBsu D2 ring in the cup (AGBsu D2-cup, in cyan) and saucer (AGBsu D2-saucer, in teal).

