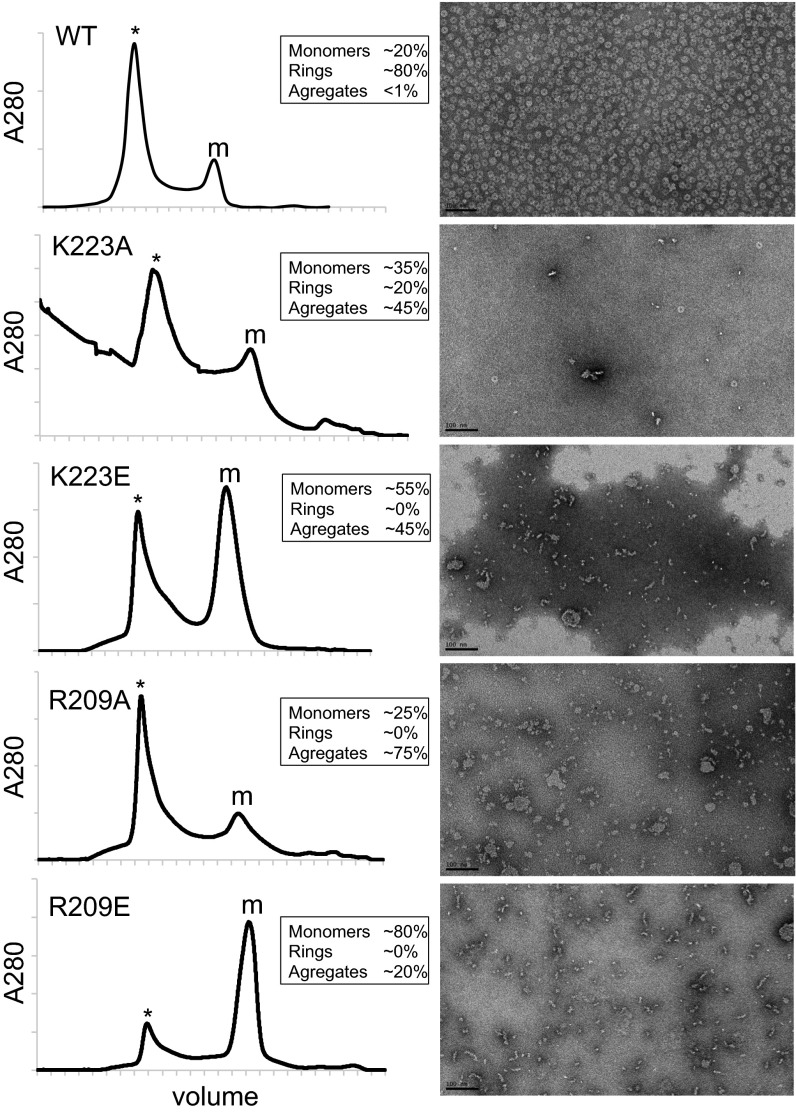
Fig. S5.
In vitro test of the AG ring model. Size-exclusion chromatography of purified wild-type AGBsu D1+D2 and the indicated mutants. (Left) Elution volumes from a Superdex 200 column are plotted on the x axis, and the 280-nm absorbance is plotted on the y axis. The elution peaks containing AGBsu D1+D2 monomers (m) and rings and/or aggregates (*) are indicated. (Right) Negative-stain EM images of the aggregate/oligomer fractions. (Scale bars, 100 nm.) The percentage of monomers, rings, and aggregates based on size exclusion and EM is indicated for each purified protein.

