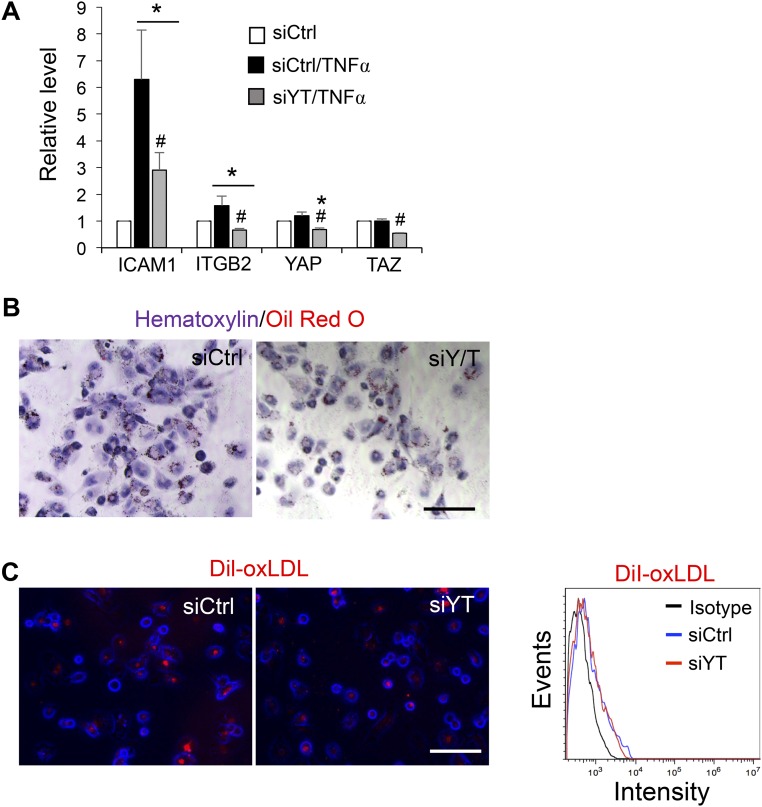
Fig. S4.
(A) THP1 monocytes were transfected with siYT or siCtrl, treated with TNFα (10 ng/mL) for 6 h, and then subjected to Western blot analysis of ICAM1 and ITGB2 (Fig. 3F). The graphic data are the quantification analysis of the Western blot results shown in Fig. 3F and presented as mean ± SD of band intensity normalized to its internal control and the respective control group. (n = 3, *P < 0.05 vs. siCtrl and #P < 0.05 vs. siCtrl/TNFα). (B and C) THP1 monocytes were transfected with siYT or siCtrl, differentiated to macrophages with phorbol myristate acetate (PMA, 25 ng/mL) for 48 h, followed by 0.5% serum starvation for 6 h, and then incubated with oxidized LDL (B) or DiI-oxLDL (C) for 12 h. The LDL uptake levels were determined by Oil Red O staining (B) and fluorescence microscopy and flow cytometric analyses of Dil-positive cells (C). (Scale bars: 100 µm.)

