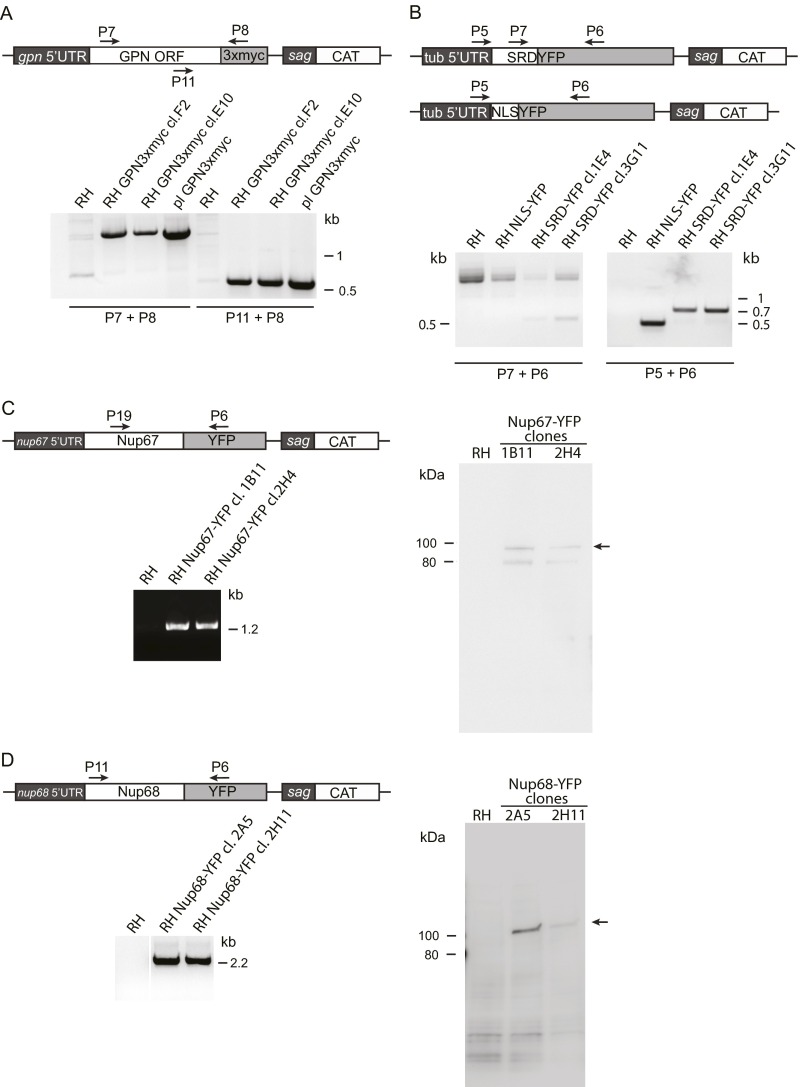
Fig. S6.
Characterization of the cell lines generated in this study. (A) An ectopic copy of GPN-loop GTPase (TGGT1_285720) was expressed under its endogenous promoter, and clones were selected for chloramphenicol resistance and analyzed by PCR. Experiments in Fig. 4 were performed with clone E10. (B) PCR analysis of clonal populations of SRD-YFP and NLS-YFP cell lines. Experiments in Fig. 4 and Fig. S7 were performed with clone 3G11 for SRD-YFP. (C) Nup67-YFP was expressed under its endogenous promoter. Two clonal populations were analyzed by PCR and Western blot. Detection with anti-GFP shows expression of the full-length fusion protein (arrow). A second, lower-molecular-weight band is also present in the clones but not in the wild type (RH). Microscopy in Fig. 5 was performed using clone 1B11. (D) Nup68-YFP clones were genotyped by PCR, and protein expression was analyzed by Western blot using anti-GFP antibody. Microscopy in Fig. 5 was performed using clone 2H11. Primer sequences are listed in Table S1.

