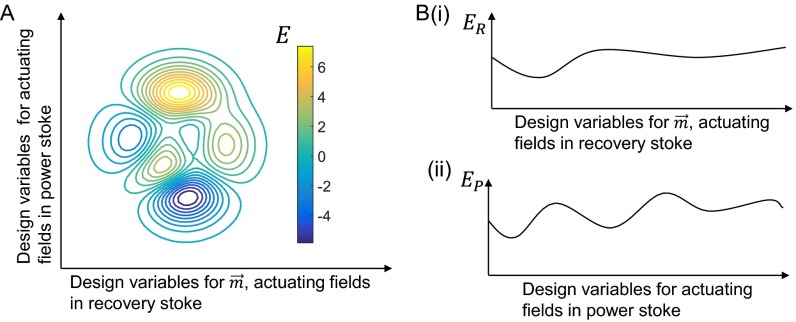
Fig. S4.
An illustration for the search space of the optimization problem for the artificial cilium. (A) The level set of the problem when there is only one optimization process. The x axis in this plot represents the design variables for and the actuating fields in the recovery stroke, whereas the y axis represents the design variables for the actuating fields in the power stroke. The isolines represent the contour of the fitness value quantified by E, where . (B) Analysis for the search space of the problem when we use the two-step optimization approach. i shows the first optimization process where only the design variables for and the actuating fields in the recovery stroke are solved. The x axis in this plot represents these design variables, and the y axis represents . ii shows the second optimization process where only the design variables for the actuating fields in the power stroke are solved. The x axis represents these design variables, and the y axis illustrates the generated function for .

