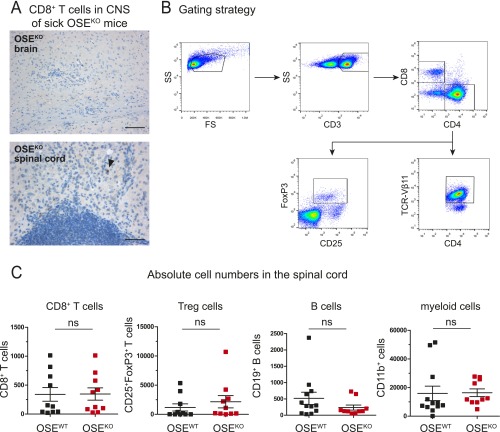
Fig. S2.
Immune cell infiltration in OSE mice. (A) Immunohistochemical analysis of CD8+ T-cell infiltration in the brain and spinal cord parenchyma of sick OSEKO mice (mean clinical score 6). [Scale bars: Upper, 100 µm (for the brain); Lower, 50 µm (for the spinal cord).] Arrowhead indicates CD8+ T cell. Representative images of four OSEKO mice are shown. (B and C) Flow cytometric analysis of different immune cell types in the periphery and CNS of age-matched OSE mice (mean age 32 d). (B) Gating strategy for the lymph nodes is shown. (C) Absolute numbers of infiltrating immune cells (as indicated) in the spinal cord, determined using cell-counting beads. Each data point represents one mouse. Data show mean ± SEM. Unpaired, two-tailed Student’s t test. ns, not significant.

