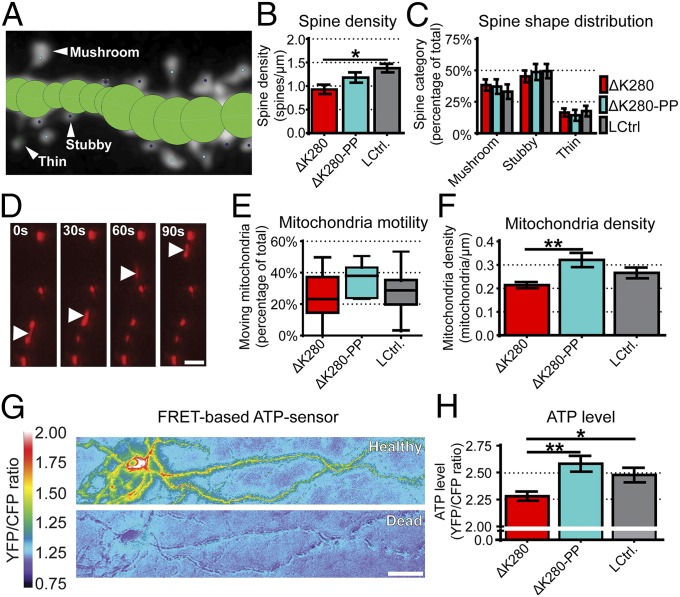
Fig. 3.
Proaggregant Tau transgenic slices have fewer spines, less axonal mitochondria, and reduced ATP levels compared with antiaggregant Tau transgenic or control littermates. (A) Example image of semiautomated spine counting. (B) Graph representing total number of spines per micrometer for proaggregant (ΔK280), antiaggregant (ΔK280-PP), and control littermate (LCtrl.) slices. *P < 0.05. (C) Graph showing the distribution of different spine categories obtained using NeuronStudio. Data are expressed as a percentage of total number of spines analyzed. (D) Images showing an example of a moving mitochondrion within an axon at different time points. (Scale bar: 10 µm.) (E and F) Graph representing the percentage of moving mitochondria in the different groups analyzed (E) and the density of mitochondria per micrometer of axon. **P < 0.01 (F). (G) Representative image of a neuron expressing the ATP sensor in a healthy state (Upper, YFP/CFP > 2) and after death (Lower, YFP/CFP ∼ 1). (Scale bar: 50 µm.) (H) ATP levels displayed as the background-corrected ratio between YFP and CFP. (**P < 0.01 and *P < 0.05, compared with Tau-ΔK280 slices.) All error bars indicate SEM. Significant differences determined by using one-way ANOVA with Tukey’s test.

