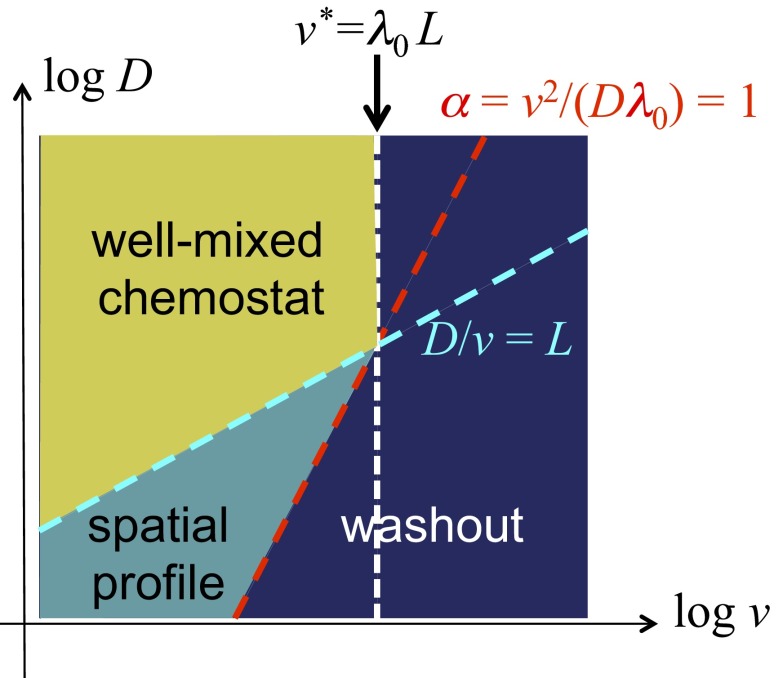
Fig. 3.
Qualitative description of the behaviors of the reaction–diffusion model. The combined effect of flow and mixing defines a “diffusive mixing length” ℓ ≡ D/v. For length scale below ℓ, the culture is locally well mixed. If mixing is sufficiently strong such that ℓ becomes comparable to the length of the channel, i.e., ℓ ∼ L, then we may regard the entire channel as a well-mixed chemostat, with a “dilution rate” v/L. A chemostat can only sustain a stable culture below the chemostat washout condition (49), i.e., when the ratio of dilution and growth rates, αL ≡ (v/L)/λ, is below 1. This translates to a critical flow velocity v* = λL above which washout occurs (dark-blue region). This condition is shown as the dashed white line, together with the dashed cyan line, ℓ = L, which indicates the boundary of the chemostat regime (region in yellow). For lower degrees of mixing where ℓ ≤ L (below the dashed cyan line), chemostat results do not apply. Here, the system consists of a number of locally well-mixed segments of length ℓ, and the characteristic ratio of dilution to growth becomes α ≡ (v/ℓ)/λ = v2/(Dλ) for each of these segments. We may expect α = 1 as an approximate criterion for washout in a long channel. This condition is shown as the dashed red line, above which washout occurs (dark blue). In between the cyan and red line (teal region), we expect a stable solution to exist in the channel. Solution in this regime is generally not expected to be spatially uniform, as it is no longer well mixed.

