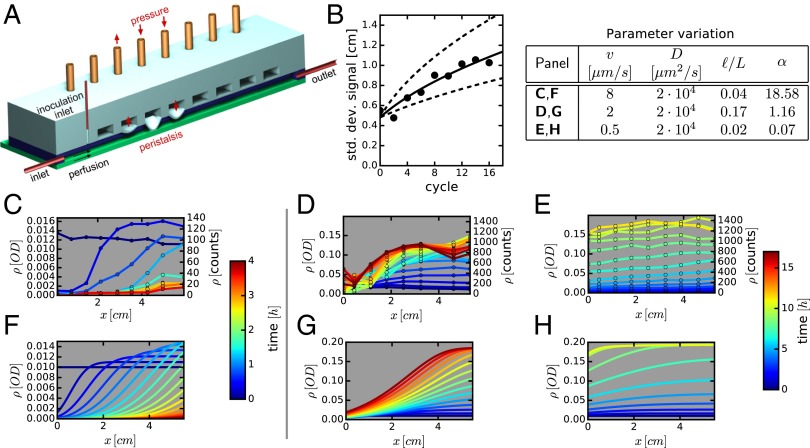
Fig. 4.
Effect of mixing and flow on bacterial growth. (A) Schematic of the minigut device with controlled “contractions” implemented by pressure-induced membrane deformations. (B) Mixing dynamics due to wall contraction is quantified by locally injecting fluorescent dye near the middle of the channel and measuring the spreading of the dye distribution along the channel with time. The width of the distribution is shown after different numbers of cycles of peristaltic contractions. The data are shown for a waiting time of 120 s between cycles, and it is fitted to diffusion-like spreading (solid line), with an effective diffusion constant of D = 2 · 104 μm2/s; see SI Appendix, Fig. S5 for further details. (C–E) Cells from strain EQ403 grown in the device at different flow conditions. Bacterial densities measured at various times and locations are plotted. Each line is a snapshot of the density profile, with the time color-coded. (C) Flow-dominated regime with no cells in steady state (washout). (D) Intermediate regime with distinct spatial dependence of bacterial density. (E) Mixing-dominated regime with little spatial dependence. The flow and mixing parameters are indicated in the legend table. (F–H) Numerical simulations of the corresponding system using the reaction–diffusion model with only independently measured parameters; see Spatiotemporal Density Profiles in the Minigut. Experimentally measured cell counts are converted to optical density (OD) using a constant conversion factor (SI Appendix, Fig. S6). Relative errors in density are below 20%.

