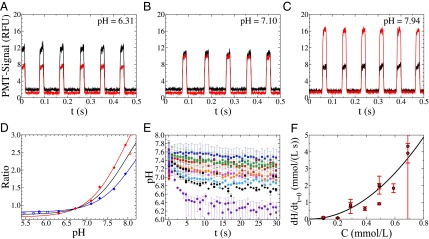
Fig. 1.
(A–C) Signal of the different photomultipliers at higher (647 nm, red line) and lower (580 nm, black line) wavelength for a pH of the aqueous phase of 6.31 (A), 7.10 (B), and 7.94 (C). (D) Calibration of the ratio of the fluorescent signals in relation to the pH of the original solution [repetitions (red and blue) and mean (black)]. (E) pH change with time for surfactant concentrations of 0.05 mM (blue), 0.10 mM (red), 0.20 mM (green), 0.29 mM (pink), 0.39 mM (orange), 0.49 mM (black), 0.59 mM (light blue), and 0.69 mM (purple). The error bars show the uncertainty due to the calibration of the ratio of the signals versus the pH. (F) Speed of the reaction at time 0 for the different concentrations of surfactant used. The error bars correspond to the uncertainty on the fitting parameter (SI Text and Fig. S8).

