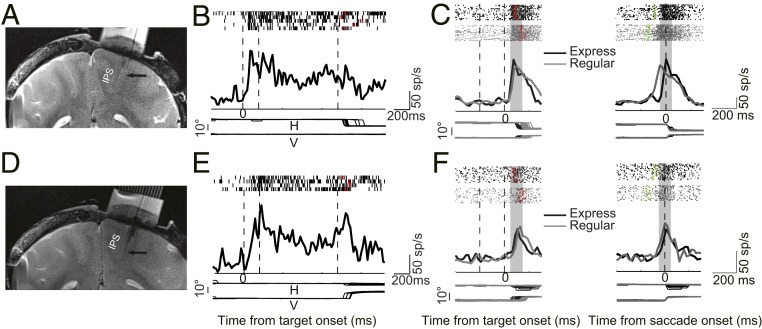
Fig. 2.
Recording sites and response of two example neurons in the MGS and Gap saccade tasks. (A) MRI image shows the recording location of an example LIP neuron. The arrow indicates that the tip of the electrode is in LIPd. (B) This neuron showed persistent activity in the MGS task. (C) Activity of an example LIPd neuron in the Gap saccade task with alignment at the visual target onset (Left) and the saccade onset (Right). The raster represents the spike train (Top), the spike density histogram is plotted (Center), and horizontal and vertical eye positions are plotted (Bottom). Red and green dots in the raster indicate the time of saccade start and visual target onset, respectively. Gray patches denote the time interval for analysis of the CC between activity in express and regular saccades. (D) MRI image shows that the recording location of the second example neuron is in LIPv (arrow). (E and F) Activity of the second example neuron in the MGS and Gap saccade tasks with the same format as in the first example neuron. sp/s, spikes per second.

