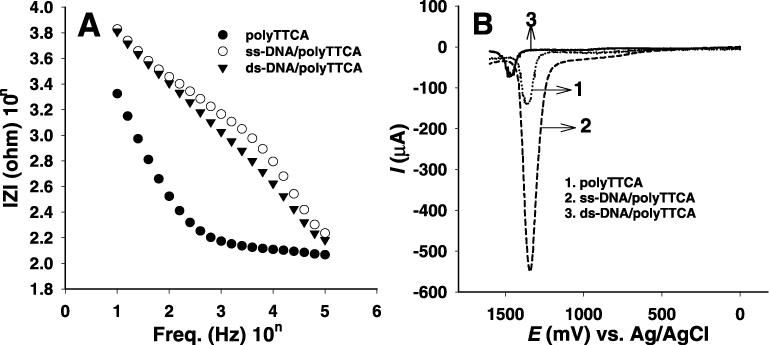
Figure 2.

(A) Impedance spectra and (B) differential pulse voltammograms recorded for (1) polyTTCA, (2) ss-DNA/polyTTCA and (3) ds-DNA/polyTTCA-modified GCEs. Impedance spectra and differential pulse voltammograms were recorded after 1 h hybridization in a phosphate buffer solution of pH 7.4. The impedance and current changes reveal the degree of hybridization.
