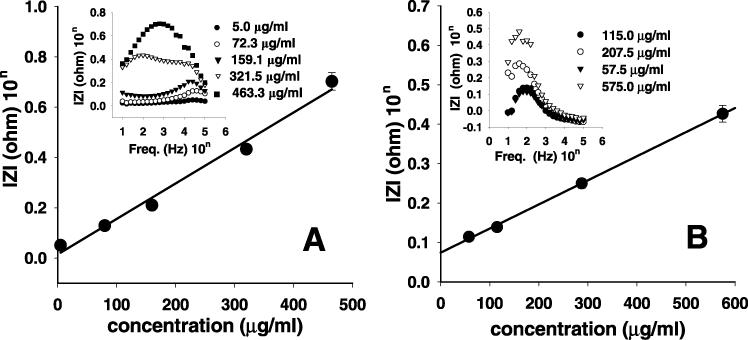
Figure 6.

(A) The calibration plots for the determination of mPurβ with ss-DNA-modified electrodes (inset: the difference of impedance spectra for ss-DNA before and after binding with mPurβ in difference concentrations). (B) The calibration plots for the determination of MutH with ds-DNA-modified electrodes (inset: the difference in the impedance spectra for ds-DNA before and after binding with MutH at different concentrations). The highest difference represents the higher concentration of protein.
