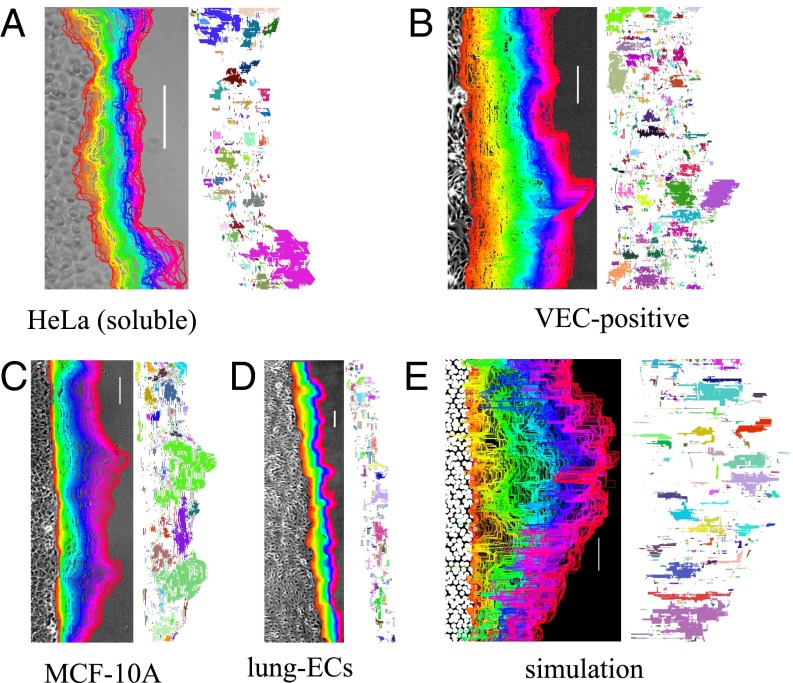
Fig. 1.
Cell-front dynamics displays activity bursts. Examples of cell fronts and their time evolution and the corresponding activity maps. Cell fronts are colored according to time. Regions marked by the same color in the activity map move collectively. (Scale bar, 100 μm.) (A) HeLa cells moving on soluble collagen substrates. (B) Mouse endothelial cells derived from embryonic stem cells (VEC-positive). (C) Human mammary epithelial cells (MCF-10A). (D) Mouse endothelial cells extracted from lungs (lung-ECs). (E) Numerical simulations of the model.

