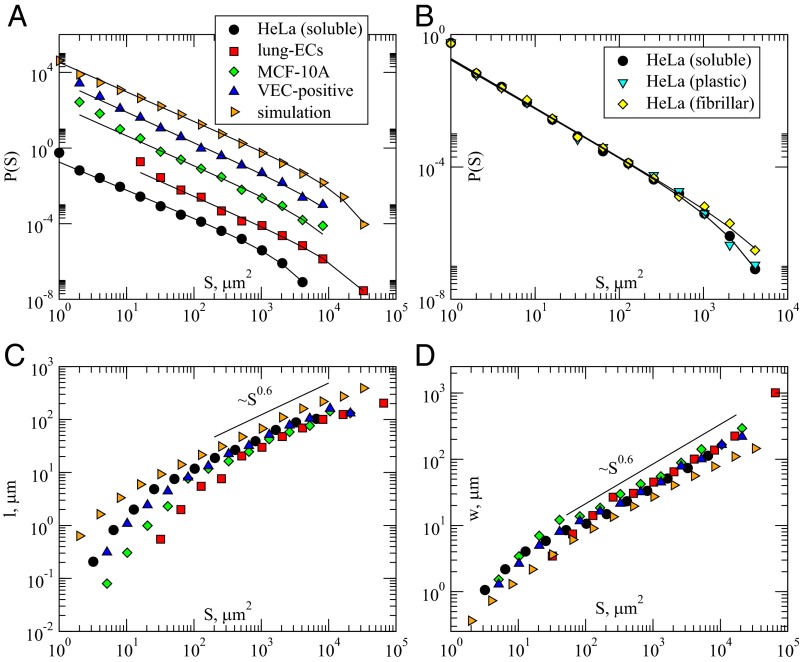
Fig. 2.
Cell activity bursts statistics displays scaling. (A) Distributions of the areas of activity clusters display power-law scaling with a cutoff. The distributions for different cell types have been shifted for clarity. The slope obtained fitting the distributions is very similar for all cell types. (B) Distributions of the areas of activity clusters for HeLa cells moving on different substrates. The scaling exponent is the same but the cutoff size for fibrillar collagen substrates is larger than for plastic and soluble collagen substrates. (C) The average cluster length and (D) the average cluster width scale with the cluster size with an exponent that is independent of the cell type.

