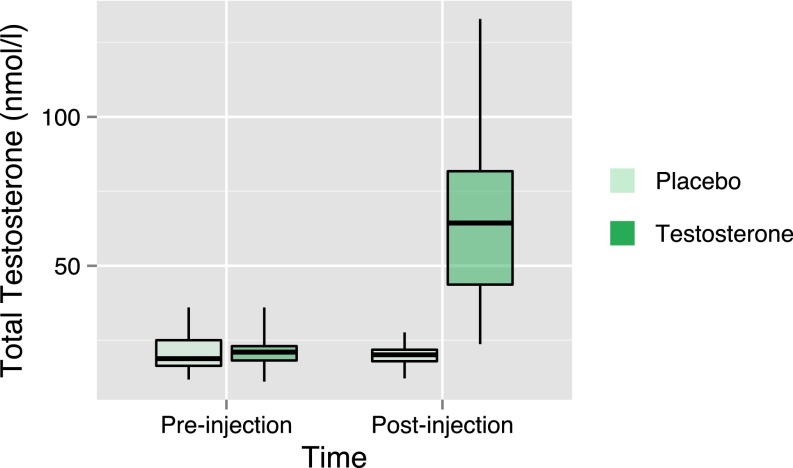
Fig. S1.
Testosterone levels. Box plot summarizing serum concentrations of TT at screening (preinjection) and the time of behavioral testing (postinjection) in the placebo (pale green) and testosterone (dark green) groups. Box centers correspond to median values, box bottoms and tops correspond to the first and third quartiles respectively, and whiskers represent the maximum and minimum concentrations. Pre- and postinjection testosterone levels did not differ significantly in the placebo group (Mann–Whitney U = 162, P = 0.64, two tailed), but in the treatment group, postinjection levels were significantly elevated (Mann-Whitney U = 4, P < 0.001, one sided).

