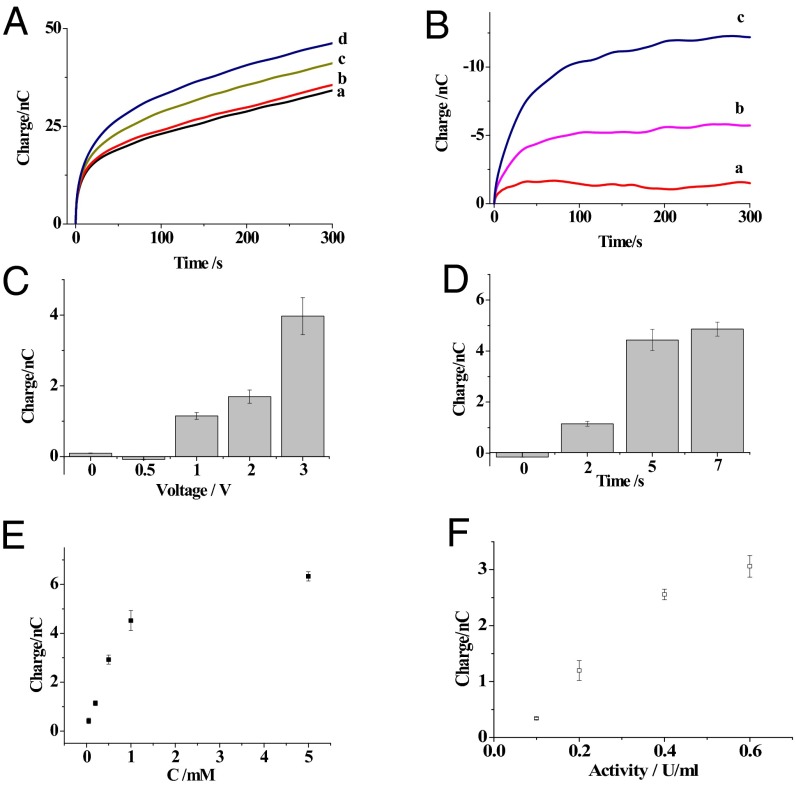
Fig. 3.
(A) The charges of the nanokit exposed to 10 mM PBS (pH 7.4; curve a) or 10 mM PBS with 0.2 (curve b), 1 (curve c), or 5 mM glucose (curve d). (B) The differences in the charges collected in 0.2 (curve a), 1 (curve b), and 5 mM glucose (curve c) after extracting the nonfaradic charge collected in PBS. (C) The differences in the charges of the nanokit exposed to 0.2 mM glucose and different voltages for 2 s. (D) The differences in the charges of the nanokit exposed to 0.2 mM glucose and 1 V for different times. (E) The correlation between the differences in the charges and the glucose concentrations. (F) The correlation between the differences in charges and SMase activity. The error bars represent the SDs from three independent experiments.

