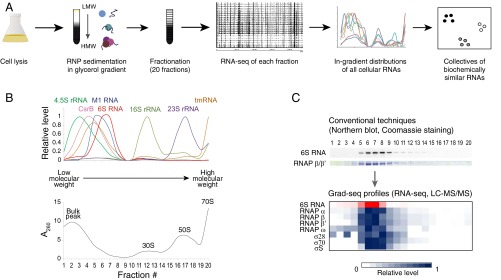
Fig. 1.
Grad-seq visualizes the Salmonella RNA interactome. (A) Grad-seq experimental strategy. (B) RNA-seq–based in-gradient distributions of housekeeping RNAs (all profiles are standardized to the range from 0 to 1). M1 and 4.5S RNAs are the RNA subunits of RNase P and SRP, respectively. CsrB is a CsrA-sequestering ncRNA. The UV profile of the corresponding gradient showing the bulk peak of low molecular weight complexes and the positions of ribosomal subunits is provided below. (C) The 6S RNA (in complex with the RNA polymerase holoenzyme) visualized with conventional techniques (Top, cropped from SI Appendix, Fig. S3A) and by Grad-seq (heat map below, all profiles are standardized to the range from 0 to 1).

