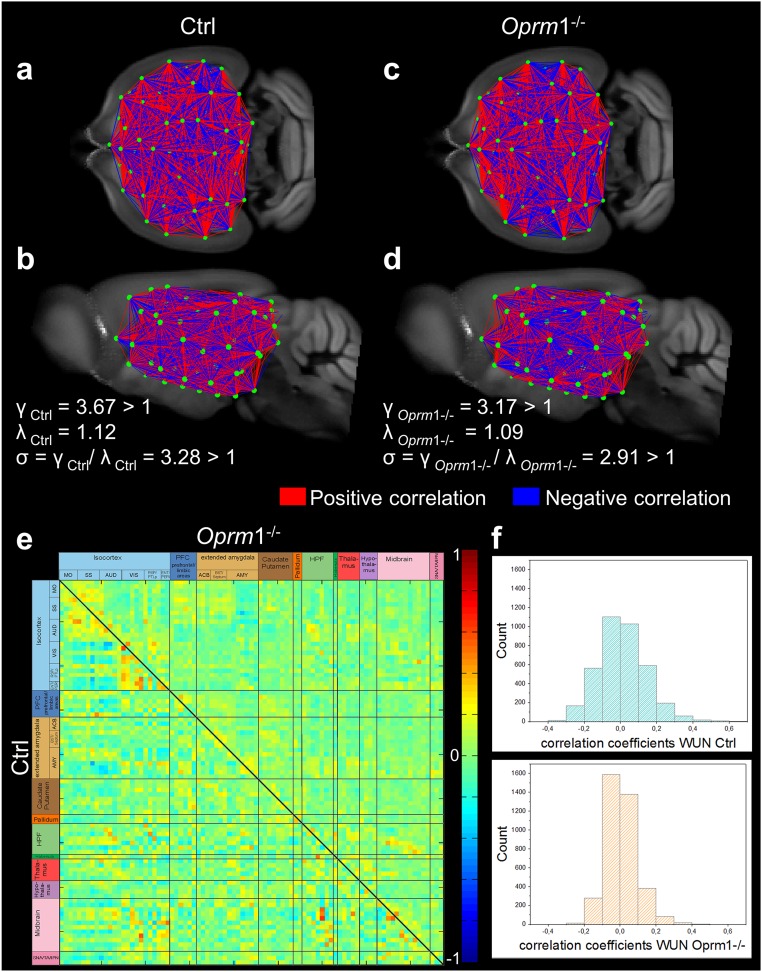
Fig. S3.
Fine-grained 3D-mapping of the mouse brain resting-state functional networks in control (Ctrl, n = 14) and MOR knockout (Oprm1−/−, n = 14) living mice reveals distinct connectivity matrices. (A–D) Whole-brain connectivity matrix in Ctrl (A, coronal; B, sagittal views) and Oprm1−/− (C, coronal; D, sagittal views) mice. Key elements of these networks are nodes (green dots) and connections (red and blue lines) between the nodes. Network nodes were identified via blind-source spatial separation of the low-frequency fluctuations (<0.01Hz) of the BOLD signal, using ICA. The connections between pairs of nodes were defined as direct statistical correlations of BOLD signal fluctuations overtime in the connected areas. Nodes linked in red (positive correlations) showed coherent BOLD signal fluctuations, whereas the blue lines (negative correlations) marked anticorrelated relationships in spontaneous signal fluctuations. The genetic deletion remodels the FC matrix in live Oprm1−/− mice, which show distinct clustering pattern of correlated and anticorrelated connections in both cortical and subcortical areas. Note that despite widespread changes in the brain FC matrix, the network of Oprm1−/− mice displayed small-world features (D) similar to the control group (B). In both genotypes, the ratio γ = C/Crand was greater than 1, the ratio λ = L/Lrand was close to 1, and the scalar measure of small worldness σ = γ/λ was ≥ 1 (see SI Materials and Methods and ref. 58), indicating together that optimal configurations for global information transfer and local processing remains in mutant mice. (E) Strength of the internode connectivity (correlation coefficients) is presented in the PC matrices of Ctrl (lower triangular matrix) and Oprm1−/− groups, rearranged according to broader brain associated with anatomical areas (as also presented in Fig. 1A). (F) Histogram showing the distribution of internode FC correlation coefficients. The width of this distribution is remarkably smaller in Oprm1−/− compared with the Ctrl group.

