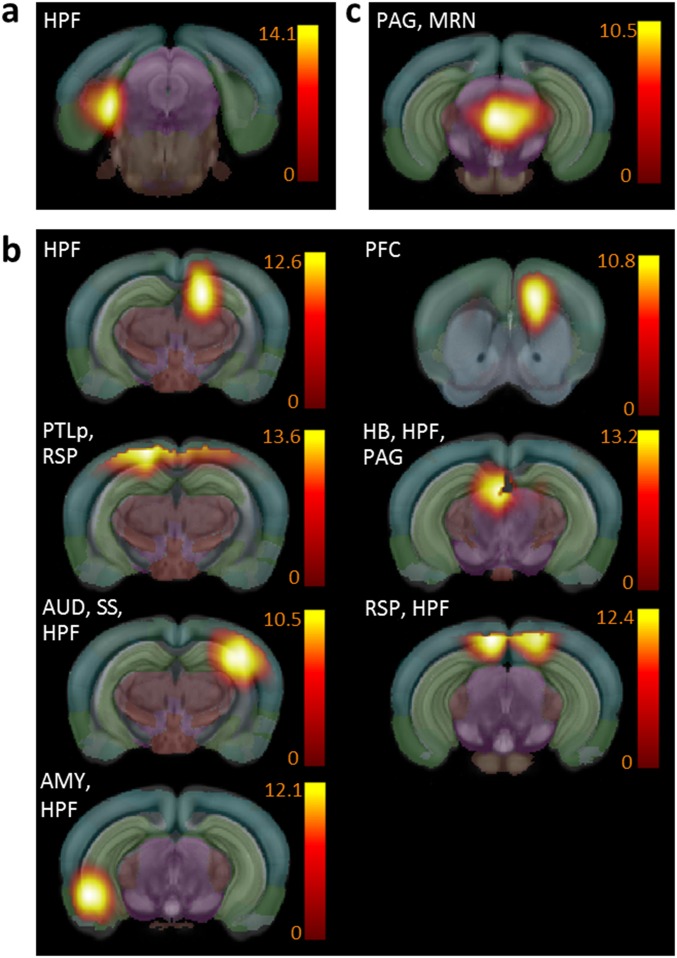
Fig. S5.
Mouse brain functional hubs identified from combined positive and negative correlation analysis. (A) Functional hubs found in both Ctrl (positive correlations: normalized strength > 0.24 and diversity > 0.36; and negative correlations: normalized strength > |−0.19| and diversity > 0.47) and Oprm1−/− (positive correlations: normalized strength > 0.17 and diversity > 0.34; and negative correlations: normalized strength > |−0.11| and diversity > 0.39) mice (see SI Materials and Methods as well). (B) Hubs detected only in the Ctrl group include HB (selection criteria: Ctrl group: positive correlations, normalized strength > 0.24 and diversity > 0.36; and negative correlations, normalized strength > |−0.19| and diversity > 0.47; whereas for the Oprm1−/− group the following criteria was not fulfilled: positive correlations, normalized strength > 0.17 and diversity > 0.34; and negative correlations, normalized strength > |−0.11| and diversity > 0.39). (C) Ventro-medial rostral PAG/MRN remains the only hub detected in Oprm1−/− mice (for the Ctrl group the following criteria was not fulfilled: positive correlations, normalized strength > 0.24 and diversity > 0.36; and negative correlations, normalized strength > |−0.19| and diversity > 0.47; whereas for the Oprm1−/− group positive correlations, normalized strength > 0.17 and diversity > 0.34; and negative correlations, normalized strength > |−0.11| and diversity > 0.39).

