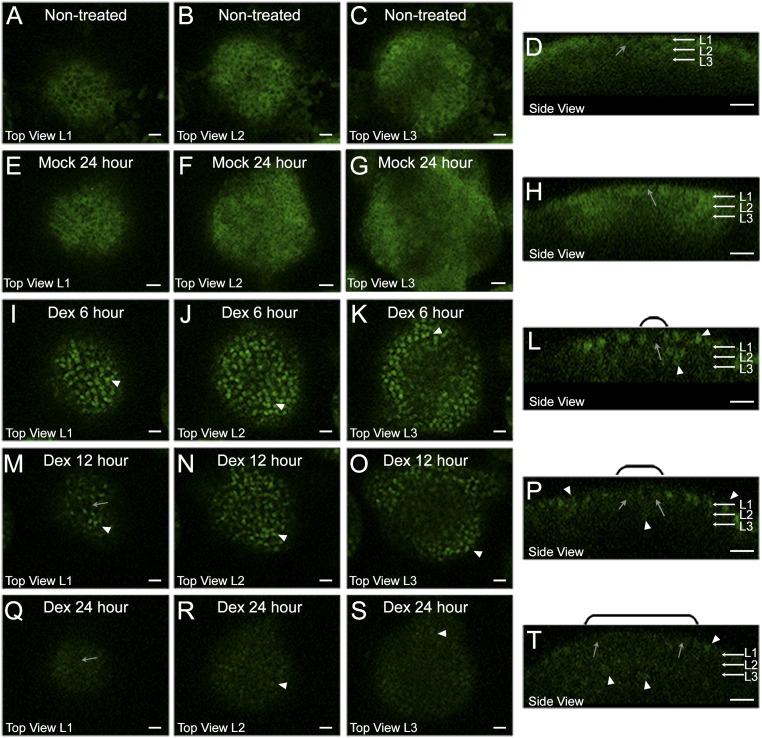
Fig. 4.
Ectopic overexpression of WUS destabilizes WUS protein. Vertical columns represent (A, E, I, M, and Q) the L1 layers, (B, F, J, N, and R) the L2 layers, (C, G, K, O, and S) the apical L3 layers, and (D, H, L, P, and T) the side views of inflorescence meristems expressing 35S::eGFP-WUS-GR. Shown are (A–D) untreated and (E–H) 24 h mock treatment. Dex treatment for (I–L) 6 h, (M–P) 12 h, and (Q–T) 24 h. White arrowheads indicate high nuclear levels, and gray arrows indicate cells with low nuclear accumulation. The domains of low nuclear accumulation, shown in side views, are noted with black brackets. Green channel is enhanced in all images to increase visibility of the protein. eGFP-WUS-GR (green) and FM4-64 (red). (Scale bars 15 µm.)

