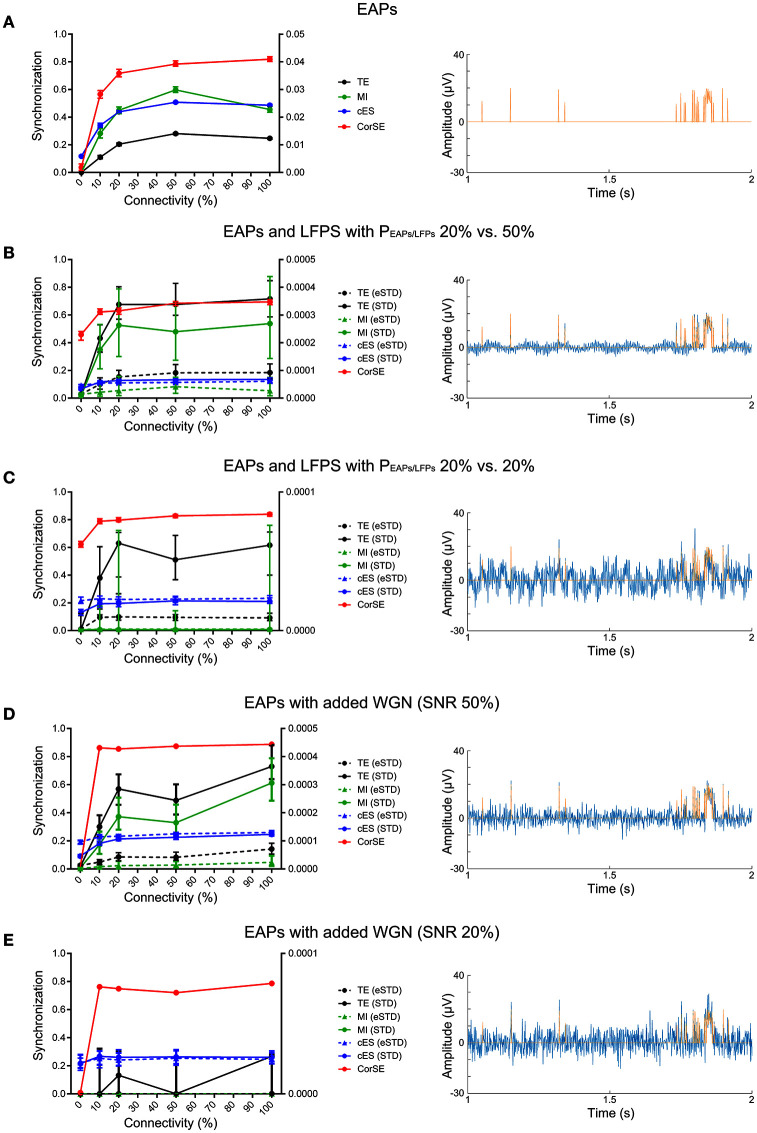
Figure 4.
The synchronization results by the different algorithms for the different connectivity levels. Left-hand panels present the synchronicities calculated for the artificial recordings by CorSE (red) and cES (blue) methods (left vertical axis), and TE (black) and MI (green) methods (right vertical axis). For the event based methods, the line types indicate the spike detection method used: STD (solid), and eSTD (dashed). The right-hand panels show exemplary 2 s signal segments with EAPs (orange), and LFP or WGN (blue) signal components. The left-hand panels: (A) Synchronicities calculated from the artificial recordings with only EAPs. (B) The synchronicities calculated from the artificial recordings with both EAPs and LFPs with PEAPs/LFPs ≈ 50 % for one population and PEAPs/LFPs ≈ 20 % for the other. (C) Synchronicities calculated from the artificial recordings with both EAPs and LFPs with PEAPs/LFPs ≈ 20 % for both populations. (D) Synchronicities calculated from the artificial recordings with EAPs and added WGN with SNR = 50 %. (E) The synchronicities calculated from the artificial recordings with EAPs and added WGN with SNR = 20 %.

