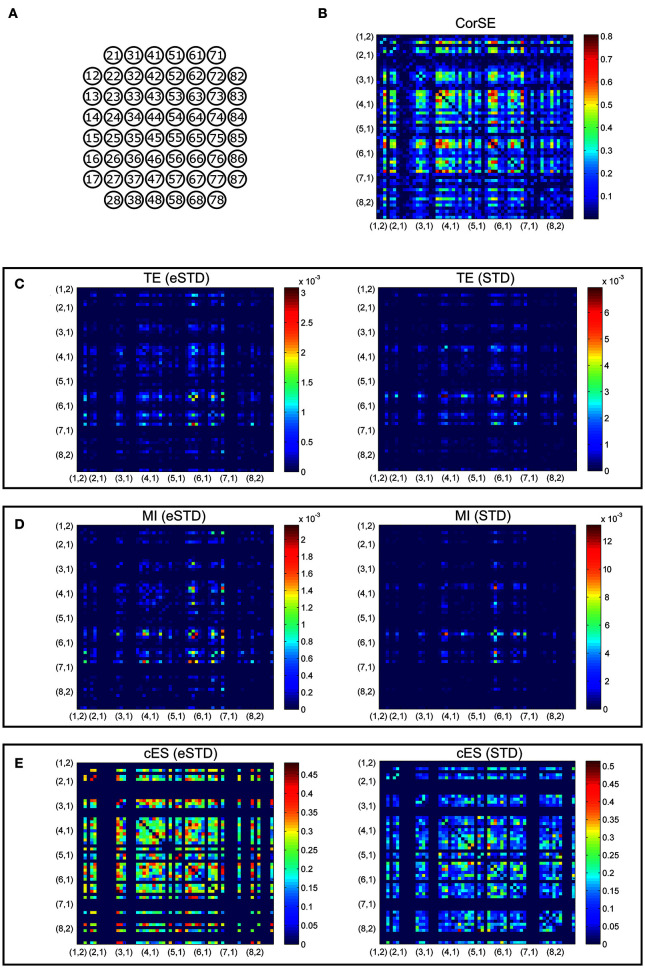
Figure 5.
Adjacency matrixes of the synchronization values given by the different algorithms for MEA1. (A) MEA layout. The synchronization values calculated with (B) CorSE, (C) TE with eSTD (left) and with STD (right), (D) MI with eSTD (left) and with STD (right), and (E) cES with eSTD (left) and with STD (right). The color scales are normalized for each matrix separately regarding to the maximum value obtained.

