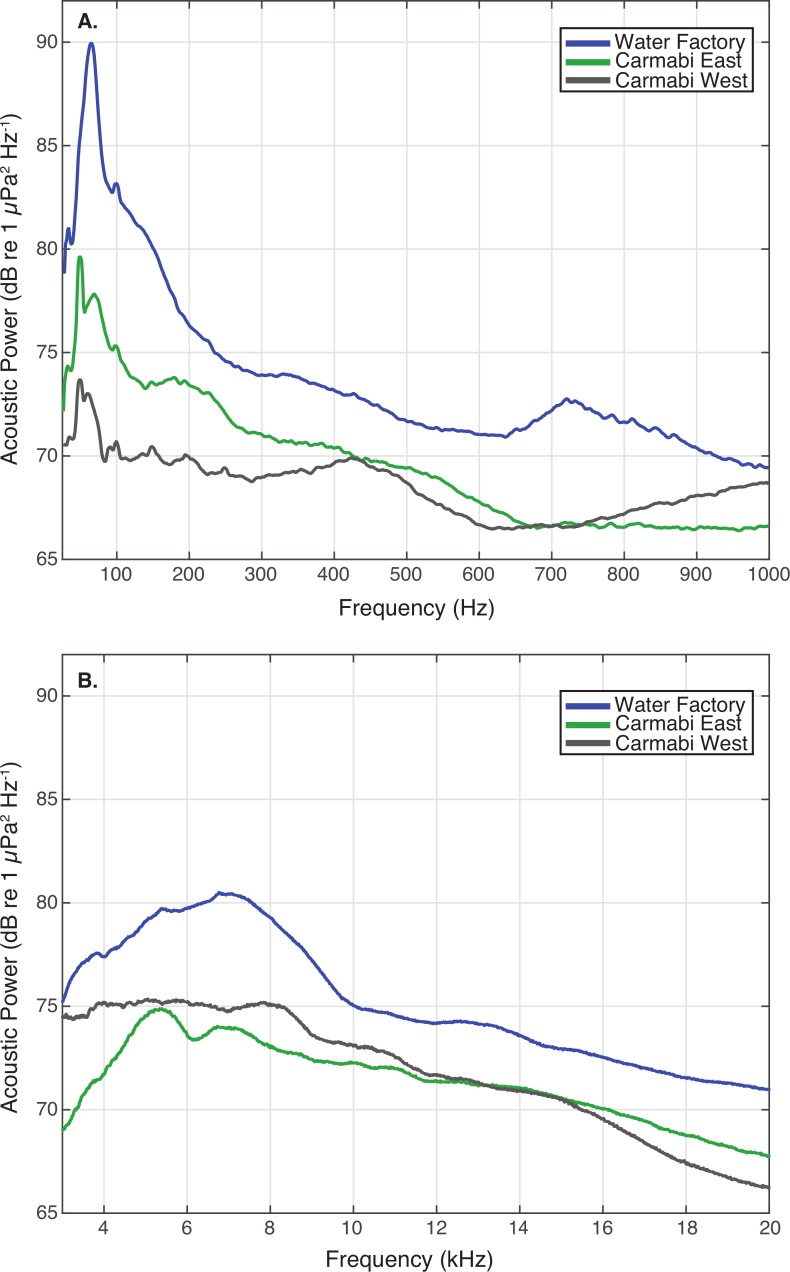
Figure 3. Reef site acoustic spectra.
Median acoustic spectra for recordings collected at each experimental site during the settlement experiment, in (A) a lower frequency bandwidth (25–1,000 Hz), and (B) upper frequency bandwidth (3–20 kHz). The median power spectrum was determined for each site using spectra generated for 2-minute samples taken every 10-minutes throughout the settlement trials (September 21–25), using 0.5-second non-overlapping Hanning windows.

