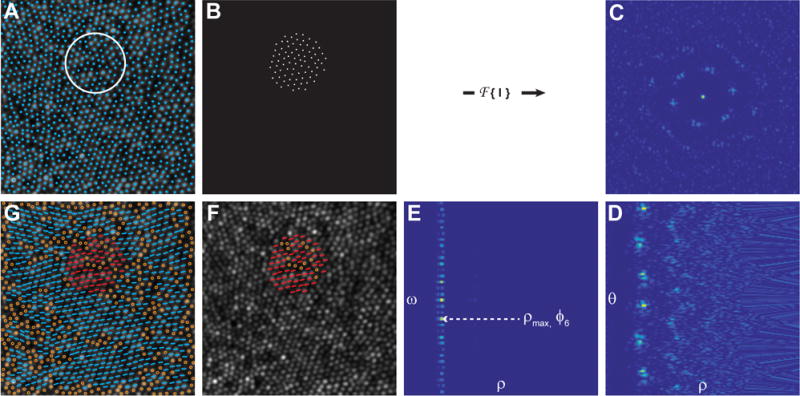
Figure 1. Outline of the steps to retrieve the orientation of individual cones using the Fourier method.

A) Individual cones in an image of the cone mosaic (AOSLO) are identified using a cone identification algorithm, and the mean inter-cell neighbor distance is calculated. A region of interest (ROI; white circle) with a diameter 4.5 times greater than the inter-cell distances is sampled uniformly across the image such that each ROI overlaps by 50% with each of its neighboring ROIs. B) For each ROI, a binary mask is used to generate an image of the cone coordinates, I(x,y). C) The power spectrum, f(u,v) = FFT (|I(x,y)|2), is calculated for each ROI and converted to polar coordinates, f(ρ,θ), as shown in (D). E) Next, a 1D – FFT is performed on the angular content of the power spectrum of f(ρ,θ): F(ρ,ω) =. The spatial characteristic length scale, associated with the hexagonal arrangement of the cones within the ROI, is defined as dhex = 1/ρmax, in which ρmax represents the maximum value of the module F(ρ,6). F) The corresponding local mean orientation of the hexagonal arrangement is calculated as ϕ6 = − arg(F(ρmax,6)/6) and it expresses the average angular hexagonal neighbor orientation for each ROI. G) The final orientation for each six-sided cell is computed by taking the mean of average angular hexagonal neighbor orientations of the ROI in which that cell fell. Non six-sided cells are shown as open circles in F & G. The AO image subtends a 120×120 μm area.
