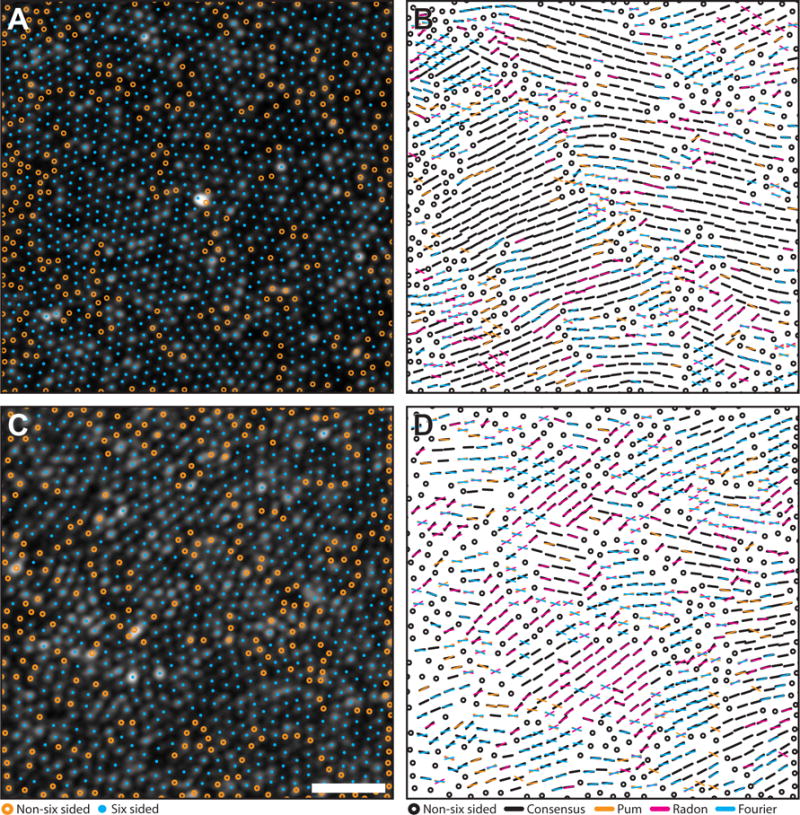
Figure 5. Comparison of orientation algorithms using real mosaics.

Algorithm agreement in AOSLO images of the parafoveal cone mosaic with a highest (A–B) and lowest (C–D) agreement. Cyan circles mark six-sided cell locations. Orange circles mark to unanalyzed, non-six sided cells. Black bars are locations where at least two algorithms agreed within their combined tolerances (6°). Each color in the right column corresponds to results from each algorithm (Pum: orange, Radon: magenta, Fourier: cyan). If one algorithm was outside tolerance, a bar with the corresponding color was overlaid on the black bar. If all three algorithms disagreed, the orientation from each method is plotted. Scale bar is 20 μm.
