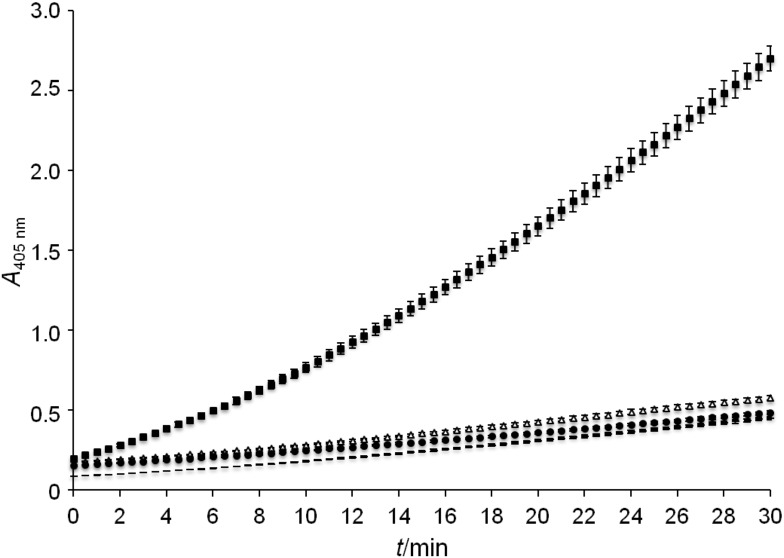
Fig. 6.
Esterase activity assay of cells displaying EstA (■), cells displaying mCherry (Δ), cells with empty expression vector (●), and cell-free sample (־־). Cell cultivation and protein expression were performed as described, cells were washed twice, resuspended in 100 mM Tris/HCl buffer, pH=7.0, containing 3.2 mM p-nitrophenyl acetate, and absorption at 405 nm was monitored photometrically for 30 min

