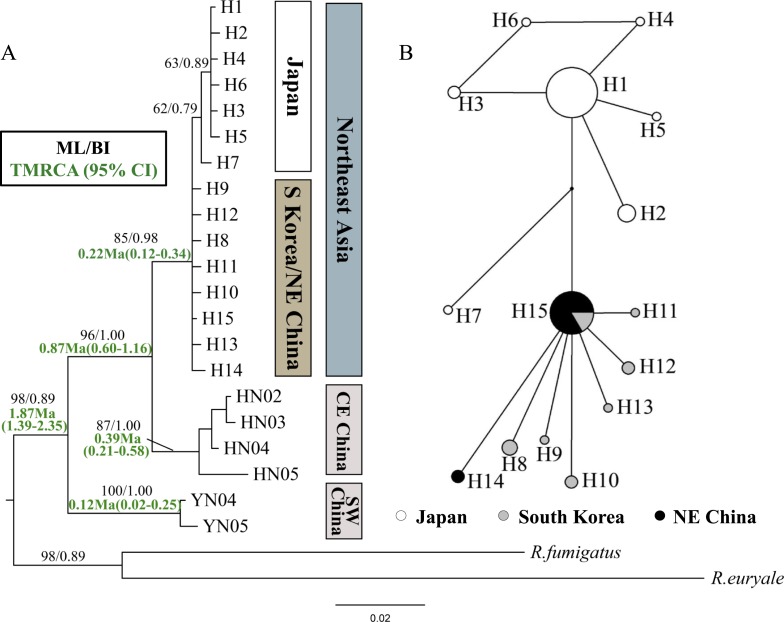
Figure 2. Phylogenetic trees and network for Rhinolophus ferrumequinum populations based on cyt b haplotypes.
(A) Phylogenetic trees constructed by ML and BI methods. (B) Median-joining network for the East Asian R. ferrumequinum haplotypes. The circle size is proportional to the frequency of that haplotype. Small black dots represent missing haplotypes. Locality codes and haplotype are described in Tables S1 and S2, respectively.

