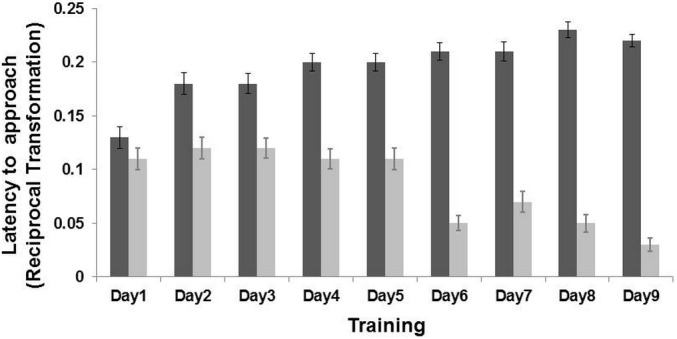
Figure 2. Results of the training phase.

Latency (Mean ± SE) to reach the positive location (dark grey bar) and the negative location (light grey bar) during the nine days of training. The latency time was transformed (1/Xi), and therefore higher latency times indicate faster approaches and vice versa. There was an interaction effect between training day and locations (LMM: p < 0.001).
