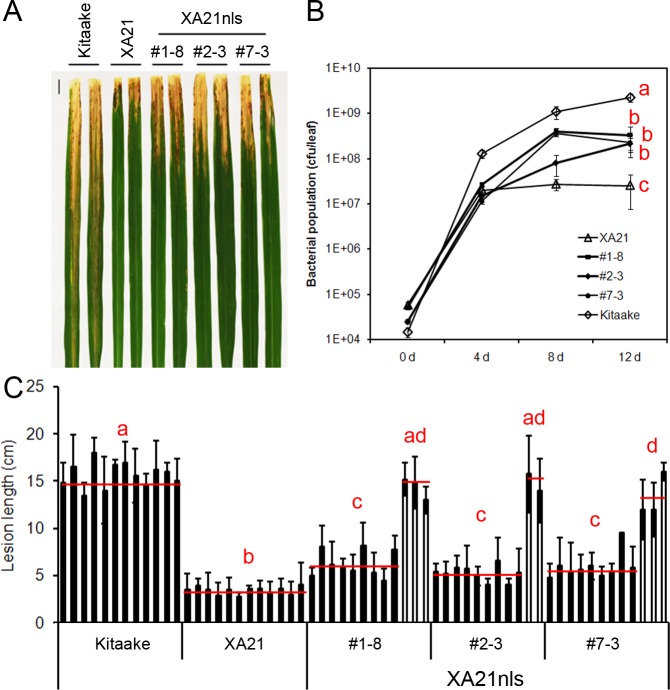
Figure 2. T2 generation of Ubi-XA21nls-GFP plants display partial resistance to Xoo.
(A) Leaves of Kitaake, Ubi-XA21-GFP (XA21), and T2 progeny derived from three independent Ubi-XA21nls-GFP T1 lines (#1–8, #2–3 and #7–3) 14 days post-inoculation (dpi). (B) Bacterial population in Kitaake, Ubi-XA21-GFP, and Ubi-XA21nls-GFP plants at 0, 4, 8 and 12 dpi determined by the number of colony-forming units (CFU) per inoculated leaf. Error bars represent standard deviation from at least four leaves. (C) Lesion lengths of Kitaake, Ubi-XA21-GFP, and Ubi-XA21nls-GFP plants at 14 dpi. The segregants (closed columns) and null segregants (open columns) in each Ubi-XA21nls-GFP line were separated into two groups for statistical analysis. Bars represent mean ± SD from about six leaves. The red horizontal line indicates the average lesion length of each genotype. Different letters in (B) and (C) indicate significant differences between the groups (Tukey’s honestly significant difference test, α < 0.05). This experiment was repeated a second time (Fig. S2) with similar results.

