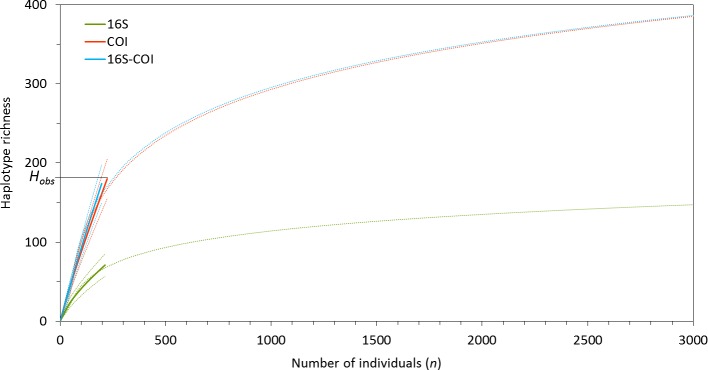
Figure 2. Individual-based rarefaction curves (solid lines) and 95% confidence intervals (dashed lines) based on COI, 16S and concatenated 16S-COI data, based on M. neritoides specimens sampled in Mosteiros (MOS), São Miguel island.
Hobs is the haplotype richness observed in the actual sample (n) from MOS. The logarithmic trendlines (dotted lines) show a prediction of the haplotype richness expected for larger sampling size at the MOS sampling site.

