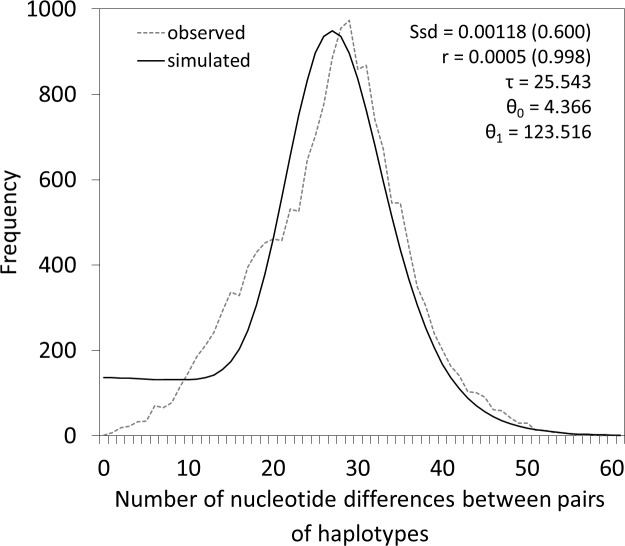
Figure 3. Mismatch distribution analysis showing the unimodal distribution of the observed number of differences between pairs of haplotypes of M. neritoides.
Ssd, sum of squared differences and p-value in parenthesis; r, Harpending’s Raggedness index and p-value in parenthesis; τ, time in generations since the last demographic expansion; θ0, initial population size; θ1, final population size.

