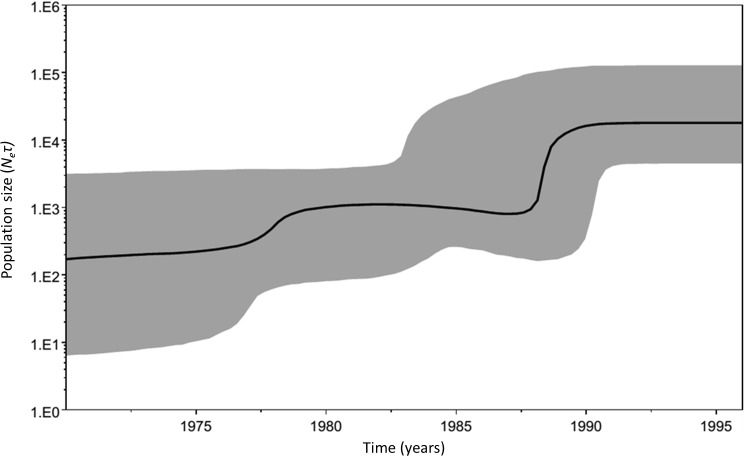
Figure 4. Historical demographic trends of the median estimate of the maternal effective population size over time (bold line) constructed using a Bayesian skyline plot approach based on concatenated 16S-COI-Cyt b haplotypes of M. neritoides sampled in 1992, 1993 and 1996.
The y-axis is the product of effective population size (Ne) and generation time (τ) in a log scale, while the x-axis is a linear scale of time in years. The 95% highest probability density (HPD) intervals are shaded in grey and represent both phylogenetic and coalescent uncertainty.

